Feature #15997
closed")
Improve performance of fiber creation by using pool allocation strategy.
Description
https://github.com/ruby/ruby/pull/2224
This PR improves the performance of fiber allocation and reuse by implementing a better stack cache.
The fiber pool manages a singly linked list of fiber pool allocations. The fiber pool allocation contains 1 or more stack (typically more, e.g. 512). It uses N^2 allocation strategy, starting at 8 initial stacks, next is 8, 16, 32, etc.
//
// base = +-------------------------------+-----------------------+  +
//        |VM Stack       |VM Stack       |                       |  |
//        |               |               |                       |  |
//        |               |               |                       |  |
//        +-------------------------------+                       |  |
//        |Machine Stack  |Machine Stack  |                       |  |
//        |               |               |                       |  |
//        |               |               |                       |  |
//        |               |               | .  .  .  .            |  |  size
//        |               |               |                       |  |
//        |               |               |                       |  |
//        |               |               |                       |  |
//        |               |               |                       |  |
//        |               |               |                       |  |
//        +-------------------------------+                       |  |
//        |Guard Page     |Guard Page     |                       |  |
//        +-------------------------------+-----------------------+  v
//
//        +------------------------------------------------------->
//
//                                  count
//
The performance improvement depends on usage:
Calculating -------------------------------------
                     compare-ruby  built-ruby
  vm2_fiber_allocate     132.900k    180.852k i/s -    100.000k times in 0.752447s 0.552939s
     vm2_fiber_count       5.317k    110.724k i/s -    100.000k times in 18.806479s 0.903145s
     vm2_fiber_reuse      160.128     347.663 i/s -     200.000 times in 1.249003s 0.575269s
    vm2_fiber_switch      13.429M     13.490M i/s -     20.000M times in 1.489303s 1.482549s

Comparison:
               vm2_fiber_allocate
          built-ruby:    180851.6 i/s
        compare-ruby:    132899.7 i/s - 1.36x  slower

                  vm2_fiber_count
          built-ruby:    110724.3 i/s
        compare-ruby:      5317.3 i/s - 20.82x  slower

                  vm2_fiber_reuse
          built-ruby:       347.7 i/s
        compare-ruby:       160.1 i/s - 2.17x  slower

                 vm2_fiber_switch
          built-ruby:  13490282.4 i/s
        compare-ruby:  13429100.0 i/s - 1.00x  slower
This test is run on Linux server with 64GB memory and 4-core Xeon (Intel Xeon CPU E3-1240 v6 @ 3.70GHz). "compare-ruby" is master, and "built-ruby" is master+fiber-pool.
Additionally, we conservatively use madvise(free) to avoid swap space usage for unused fiber stacks. However, if you remove this requirement, we can get 6x - 10x performance improvement in vm2_fiber_reuse benchmark. There are some options to deal with this (e.g. moving it to GC.compact) but as this is still a net win, I'd like to merge this PR as is.
Files
") Updated by ioquatix (Samuel Williams) almost 7 years ago
Updated by ioquatix (Samuel Williams) almost 7 years ago
@ko1 (Koichi Sasada) asked:
(1) stack size assumption
The fiber pool stack size is (guard page + vm_stack_size + fiber_machine_stack_size).
(2) maximum allocatable size
On 64-bit platform it's effectively the same, although in some situations it can be better due to reduced number of mmaps required.
On 32-bit platform, it's slightly worse, because I didn't bother implementing fallback on mmap failure. In current implementation, worst case difference is 128 fiber stacks. That being said, if you are allocating fibers up to the limit of the 32-bit address space you will quickly run into other issues, so I don't consider this a bug, it's just natural limit of 32-bit address space.
(3) GC.enable/disable usage (edited)
vm2_fiber_allocateis running withGC.disableto do fair comparison of allocation overheads.vm2_fiber_countis running with normal GC, but due to using alloca on fiber pool stack, GC pressure/count is significantly reduced. It is not expected to represent expected improvement of real world code, but shows that fiber pool code in isolation avoids GC overheads.vm2_fiber_reuseis running withGC.disableand deterministically callsGC.startafter allocating 1024 fibers to test performance of fiber reuse.vm2_fiber_switchis existing benchmark and is not affected by fiber pool implementation.
") Updated by ko1 (Koichi Sasada) almost 7 years ago
Updated by ko1 (Koichi Sasada) almost 7 years ago
ioquatix (Samuel Williams) wrote:
@ko1 (Koichi Sasada) asked:
(1) stack size assumption
The fiber pool stack size is (guard page + vm_stack_size + fiber_machine_stack_size).
which size (xx KB, etc)?
(2) maximum allocatable size
On 64-bit platform it's effectively the same, although in some situations it can be better due to reduced number of
mmaps required.On 32-bit platform, it's slightly worse, because I didn't bother implementing fallback on
mmapfailure. In current implementation, worst case difference is 128 fiber stacks. That being said, if you are allocating fibers up to the limit of the 32-bit address space you will quickly run into other issues, so I don't consider this a bug, it's just natural limit of 32-bit address space.
I know you got measurements. please share us.
(3) GC.enable/disable usage (edited)
vm2_fiber_countis running with normal GC, but due to using alloca on fiber pool stack, GC pressure/count is significantly reduced. It is not expected to represent expected improvement of real world code, but shows that fiber pool code in isolation avoids GC overheads.
In general, we should tell this memory usage to GC with rb_gc_adjust_memory_usage(). I don't think it is needed in this case.
Updated by ioquatix (Samuel Williams) almost 7 years ago
- Description updated (diff)
Updated by ioquatix (Samuel Williams) almost 7 years ago
I've removed 2e7b2a0db6 Make default fiber stack size same as thread stack size. because I think it should be separate PR.
Updated by ioquatix (Samuel Williams) almost 7 years ago
Here is a short script you can use to compare fiber allocation performance:
Updated by ioquatix (Samuel Williams) almost 7 years ago
Updated by ioquatix (Samuel Williams) almost 7 years ago
- Description updated (diff)
Updated by ioquatix (Samuel Williams) almost 7 years ago
- Description updated (diff)
Updated by ioquatix (Samuel Williams) almost 7 years ago
@matz (Yukihiro Matsumoto) do you mind giving your feedback/opinion if possible?
Updated by ioquatix (Samuel Williams) almost 7 years ago
which size (xx KB, etc)?
#define RUBY_VM_FIBER_VM_STACK_SIZE           (  16 * 1024 * sizeof(VALUE)) /*   64 KB or  128 KB */
#define RUBY_VM_FIBER_VM_STACK_SIZE_MIN       (   2 * 1024 * sizeof(VALUE)) /*    8 KB or   16 KB */
#define RUBY_VM_FIBER_MACHINE_STACK_SIZE      (  64 * 1024 * sizeof(VALUE)) /*  256 KB or  512 KB */
#if defined(__powerpc64__)
#define RUBY_VM_FIBER_MACHINE_STACK_SIZE_MIN  (  32 * 1024 * sizeof(VALUE)) /*   128 KB or  256 KB */
#else
#define RUBY_VM_FIBER_MACHINE_STACK_SIZE_MIN  (  16 * 1024 * sizeof(VALUE)) /*   64 KB or  128 KB */
#endif
Assuming page size of 4K and 64-bit platform, each fiber needs 4KB + 512KB + 16KB stack.
However, this is only part of the picture. Using the given count.rb we can divide VSZ/RSZ by number of fibers, to give "actual" usage:
2.7.0-fiber-pool

2.28s to allocate 200000 fibers
  PID    VSZ   RSZ
16105 129500736 2606936

-> 13.03KB of physical memory per fiber, 647.5KB address space per fiber
2.7.0-master

82.67s to allocate 200000 fibers
  PID    VSZ   RSZ
22398 128513292 2396224

-> 11.98KB of physical memory per fiber, 642.5KB address space per fiber
There is no significant difference, and it also looks like there might be room for improvement.
Updated by ioquatix (Samuel Williams) almost 7 years ago
I know you got measurements. please share us.
I added show_limit to bootstrap test so we can see for all platforms. However, all platforms I tested could allocate 10,000 fibers easily. e.g. all builds on Travis, AppVeyor, etc. When we explored increasing fiber stack size (to the same as thread stack size), we did create some problem for 32-bit platforms.
On Linux, we can artificially limit the memory (e.g. 4GB) to see how behaviour changes.
2.7.0-fiber-pool

$ bash -c "ulimit -v 4000000; ./ruby --disable-gems ./count.rb"
... snip ...
0.059s to create 5113 fibers [GC.count=0]
./count.rb:16:in `resume': can't alloc machine stack to fiber (1024 x 659456 bytes): Cannot allocate memory (FiberError)
2.6.3

$ bash -c "ulimit -v 4000000; ./ruby --disable-gems ./count.rb"
... snip ...
0.119s to create 6118 fibers [GC.count=0]
./count.rb:16:in `resume': can't alloc machine stack to fiber: Cannot allocate memory (FiberError)
The main concern I had for 32-bit implementation is fiber pool consuming all address space. Well, 32-bit address space is very limited. There is a simple fix for this if it's a major blocking point: we can revert back to individual fiber allocation and deallocation. It's straight forward to implement actually since all fibers now just use two functions: fiber_pool_stack_acquire and fiber_pool_stack_release. We can just replace these with direct mmap and munmap. I didn't bother because I don't know if it's problem in reality or just theoretical.
Regarding upper limits, I tested more extreme case. I could allocate 4 million fibers in about 2 minutes on my server (same specs as listed in summary), and it used 2.4TB of address space, and 50GB of actual memory. This is with GC disabled, so it's not exactly realistic test, but does show some kind of upper limit.
Updated by ioquatix (Samuel Williams) almost 7 years ago
In general, we should tell this memory usage to GC with rb_gc_adjust_memory_usage(). I don't think it is needed in this case.
Maybe I don't follow you, but I believe fiber memory usage is reported correctly by fiber_memsize and cont_memsize?
Updated by ioquatix (Samuel Williams) almost 7 years ago
I did some more research about 32-bit applications.
On Windows (32-bit), the process is limited to 2GB of memory, but address space should be 4GB. This is apparently the same for 32-bit Linux, maybe that includes arm32? There are some exceptions (PAE), but I don't know a lot about it.
If we assume we can create maximum 6000 fibers on a 32-bit platform (it's probably less in practice), if we use a pool allocator with 8 stacks per allocation, it only takes 750 fibers (6000 / 8) to deadlock the pool. What I mean is 1 stack is used out of every allocation, so we can't free any address space, even if we implemented it.
Therefore, the best approach for 32-bit architecture is probably to avoid pooled allocations. We can use existing code, but we basically restrict pool allocation to 1 stack per allocation. This way, we can always free the address space when the stack is released.
I'd be happy to receive more feedback about this proposed approach, but as it seems like the right way forward, I'll probably just implement it.
Updated by ioquatix (Samuel Williams) almost 7 years ago
Okay, so I implemented fiber pool changes which make it more suitable for 32-bit platform. It required additional book keeping. Essentially, the allocation list and free list became double linked which allows us to remove allocations and vacant stacks as required. It's more book keeping but the performance overhead is negligible.
Now, if fiber pool allocation becomes empty, we can remove it entirely. This means, the address space is freed too. So, on 32-bit platform, if we cap fiber pool size to maximum 4 - 8 stacks, maybe it's acceptable and limits fragmentation/over-use of address space.
We can also now experiment with the following situations:
- (1) When fiber pool allocation becomes unused,
munmapit; reduce physical memory usage and address space. - (2) When fiber pool stack is released,
madvise(free)it; reduce physical memory usage/swap usage only). - (3) When fiber pool stack is released, do nothing. It remains in the cache. If there is memory pressure, it can get swapped to disk.
- (4) When the fiber pool stack is released, do nothing. On major GC, do one of the above.
The code for the above decision is in fiber_pool_stack_release:
    if (stack.allocation->used == 0) {
        fiber_pool_allocation_free(stack.allocation);
    }

    fiber_pool_stack_free(&vacancy->stack);
Here are the difference I performance, on macOS, comparing with Ruby 2.6.2:
(1) munmap
               vm2_fiber_allocate
          built-ruby:    130066.1 i/s
        compare-ruby:     85436.6 i/s - 1.52x  slower

                  vm2_fiber_count
          built-ruby:     88426.2 i/s
        compare-ruby:      3811.9 i/s - 23.20x  slower

                  vm2_fiber_reuse
          built-ruby:       109.9 i/s
        compare-ruby:        61.5 i/s - 1.79x  slower

                 vm2_fiber_switch
        compare-ruby:   9437510.2 i/s
          built-ruby:   8893636.1 i/s - 1.06x  slower
(2) madvise(free)
               vm2_fiber_allocate
          built-ruby:    129641.0 i/s
        compare-ruby:    101306.1 i/s - 1.28x  slower

                  vm2_fiber_count
          built-ruby:     87447.4 i/s
        compare-ruby:      3945.7 i/s - 22.16x  slower

                  vm2_fiber_reuse
          built-ruby:       110.6 i/s
        compare-ruby:        61.7 i/s - 1.79x  slower

                 vm2_fiber_switch
        compare-ruby:   9397149.4 i/s
          built-ruby:   9095279.0 i/s - 1.03x  slower
(3) nothing
               vm2_fiber_allocate
          built-ruby:    129309.2 i/s
        compare-ruby:    103792.5 i/s - 1.25x  slower

                  vm2_fiber_count
          built-ruby:     90957.3 i/s
        compare-ruby:      4013.8 i/s - 22.66x  slower

                  vm2_fiber_reuse
          built-ruby:       644.5 i/s
        compare-ruby:        61.0 i/s - 10.56x  slower          N.B. on Linux server, it's about 7x.

                 vm2_fiber_switch
          built-ruby:   9196315.6 i/s
        compare-ruby:   8661514.5 i/s - 1.06x  slower
As you can see, trying to free address space or reduce memory/swap usage has a significant overhead in the vm2_fiber_reuse case, which is one of the most important for long running servers.
(1) & (2) look similar In terms of performance, with munmap perhaps being slightly better because it's done one when the fiber pool allocation is completely empty vs after every stack release.
(1) munmap releases address space back to system, which is ideal for 32-bit address space.
(2) madvise(free) should be much faster than munmap, but it doesn't seem significant. It leaves address space intact, but tells system that stack memory region is no longer needed, and it avoids the need to swap it to disk when there is memory pressure.
(3) address space is left in place. If system experiences memory pressure, stack areas are swapped to disk, even if unused. Because of this, if the user allocated 1 million fibers, a large amount of address space and swap space may be consumed. However I would like to believe this isn't such a big problem.
While I think the answer for 32-bit system is clearly (1), the best option for 64-bit is not obvious. (2) is pessimistic, while (3) is optimistic and may over-commit memory.
There is one solution to this however. We could utilise GC.compact or a similar mechanism. That way, we could use (3), but apply (1) and (2) as appropriate if GC.compact is invoked. There are other options here too: e.g. major GC, some kind of temporal GC (release fiber pool if it was no used after some time), madvise(free) only if more than 50% of stacks are freed, etc. However, I like simple, deterministic option, so maybe I personally lean towards GC.compact or Fiber::Pool.shared.compact, or some other similar method.
Updated by ioquatix (Samuel Williams) almost 7 years ago
I've updated the implementation for fiber pool, which now has some functionality controlled by #define FIBER_POOL_ALLOCATION_FREE.
The normal (CPU efficient, memory expensive) implementation creates and reuses fiber_pool_allocation indefinitely, and never returns the resources back to the system, so address space is not released.
If you defined FIBER_POOL_ALLOCATION_FREE, during fiber_pool_stack_release:
- We use
madvise(free)to clear dirty bit on stack memory (to avoid swapping to disk under memory pressure) and, - We use
munmapon thefiber_pool_allocationwhen it’s usage drops to 0 (extra book keeping required), and:- remove it from allocation list (double linked list required)
- remove all
fiber_pool_vacancyfrom vacancy list (double linked list required).
The consequence of #define FIBER_POOL_ALLOCATION_FREE is that fiber_pool_stack_acquire and fiber_pool_stack_release becomes more CPU expensive, but address space is released back to the system when possible and dirty pages are cleared so that swap space is not consumed. More specifically:
fiber_pool_stack_releasewill always callmadvise(free)and occasionallymunmap.fiber_pool_stack_acquireis more likely to callmmapandmprotectif more stacks are required.
We could merge this PR, and decide whether we want to be conservative or not, or maybe do it on a arch basis (e.g. 32-bit could be conservative vs 64-bit since address space is less of a concern).
Updated by ioquatix (Samuel Williams) almost 7 years ago
On Linux, comparing fiber-pool with master.
% make benchmark COMPARE_RUBY="../../ruby/build/ruby --disable-gems" ITEM=vm2_fiber RUBY_SHARED_FIBER_POOL_FREE_STACKS=0

Calculating -------------------------------------
                           master  fiber-pool
  vm2_fiber_allocate     122.128k    163.030k i/s -    100.000k times in 0.818812s 0.613385s
     vm2_fiber_count       2.717k     78.701k i/s -    100.000k times in 36.809948s 1.270639s
     vm2_fiber_reuse      155.573     935.127 i/s -     200.000 times in 1.285570s 0.213875s
    vm2_fiber_switch      12.842M     12.730M i/s -     20.000M times in 1.557340s 1.571121s

Comparison:
               vm2_fiber_allocate
          built-ruby:    163029.6 i/s
        compare-ruby:    122128.2 i/s - 1.33x  slower

                  vm2_fiber_count
          built-ruby:     78700.5 i/s
        compare-ruby:      2716.7 i/s - 28.97x  slower

                  vm2_fiber_reuse
          built-ruby:       935.1 i/s
        compare-ruby:       155.6 i/s - 6.01x  slower

                 vm2_fiber_switch
        compare-ruby:  12842411.5 i/s
          built-ruby:  12729761.1 i/s - 1.01x  slower

% make benchmark COMPARE_RUBY="../../ruby/build/ruby --disable-gems" ITEM=vm2_fiber RUBY_SHARED_FIBER_POOL_FREE_STACKS=1

Calculating -------------------------------------
                           master  fiber-pool
  vm2_fiber_allocate     122.656k    165.218k i/s -    100.000k times in 0.815289s 0.605260s
     vm2_fiber_count       2.682k     77.541k i/s -    100.000k times in 37.288038s 1.289637s
     vm2_fiber_reuse      160.836     449.224 i/s -     200.000 times in 1.243500s 0.445212s
    vm2_fiber_switch      13.159M     13.132M i/s -     20.000M times in 1.519828s 1.522983s

Comparison:
               vm2_fiber_allocate
          built-ruby:    165218.2 i/s
        compare-ruby:    122655.9 i/s - 1.35x  slower

                  vm2_fiber_count
          built-ruby:     77541.2 i/s
        compare-ruby:      2681.8 i/s - 28.91x  slower

                  vm2_fiber_reuse
          built-ruby:       449.2 i/s
        compare-ruby:       160.8 i/s - 2.79x  slower

                 vm2_fiber_switch
        compare-ruby:  13159383.0 i/s
          built-ruby:  13132119.3 i/s - 1.00x  slower
Updated by ioquatix (Samuel Williams) almost 7 years ago
On Darwin, comparing fiber-pool with master:
> make benchmark COMPARE_RUBY="../../ruby/build/ruby --disable-gems" ITEM=vm2_fiber RUBY_SHARED_FIBER_POOL_FREE_STACKS=0
Calculating -------------------------------------
                           master  fiber-pool
  vm2_fiber_allocate      99.329k    124.488k i/s -    100.000k times in 1.006759s 0.803293s
     vm2_fiber_count       3.621k     82.447k i/s -    100.000k times in 27.620062s 1.212895s
     vm2_fiber_reuse       55.039     615.402 i/s -     200.000 times in 3.633812s 0.324991s
    vm2_fiber_switch       8.803M      8.591M i/s -     20.000M times in 2.272063s 2.328041s

Comparison:
               vm2_fiber_allocate
          built-ruby:    124487.6 i/s
        compare-ruby:     99328.6 i/s - 1.25x  slower

                  vm2_fiber_count
          built-ruby:     82447.4 i/s
        compare-ruby:      3620.6 i/s - 22.77x  slower

                  vm2_fiber_reuse
          built-ruby:       615.4 i/s
        compare-ruby:        55.0 i/s - 11.18x  slower

                 vm2_fiber_switch
        compare-ruby:   8802572.8 i/s
          built-ruby:   8590914.0 i/s - 1.02x  slower

> make benchmark COMPARE_RUBY="../../ruby/build/ruby --disable-gems" ITEM=vm2_fiber RUBY_SHARED_FIBER_POOL_FREE_STACKS=1

Calculating -------------------------------------
                           master  fiber-pool
  vm2_fiber_allocate      96.834k    121.823k i/s -    100.000k times in 1.032698s 0.820865s
     vm2_fiber_count       3.027k     80.419k i/s -    100.000k times in 33.035732s 1.243489s
     vm2_fiber_reuse       56.275     449.230 i/s -     200.000 times in 3.553979s 0.445206s
    vm2_fiber_switch       8.640M      8.255M i/s -     20.000M times in 2.314890s 2.422917s

Comparison:
               vm2_fiber_allocate
          built-ruby:    121822.7 i/s
        compare-ruby:     96833.7 i/s - 1.26x  slower

                  vm2_fiber_count
          built-ruby:     80418.9 i/s
        compare-ruby:      3027.0 i/s - 26.57x  slower

                  vm2_fiber_reuse
          built-ruby:       449.2 i/s
        compare-ruby:        56.3 i/s - 7.98x  slower

                 vm2_fiber_switch
        compare-ruby:   8639719.4 i/s
          built-ruby:   8254513.1 i/s - 1.05x  slower
Updated by ioquatix (Samuel Williams) almost 7 years ago
Attached graph/table.
Updated by ioquatix (Samuel Williams) almost 7 years ago
Here is some testing using falcon and ab. ab is HTTP/1.0 client test. Because of that, each connection/request makes new fiber, so it's going to show if there are improvements/regressions to performance.
Server Software:        2.7.0-fiber-pool FREE_STACKS=0
Server Hostname:        localhost
Server Port:            9292

Document Path:          /small
Document Length:        1200 bytes

Concurrency Level:      256
Time taken for tests:   14.174 seconds
Complete requests:      100000
Failed requests:        0
Total transferred:      126000000 bytes
HTML transferred:       120000000 bytes
Requests per second:    7055.11 [#/sec] (mean)
Time per request:       36.286 [ms] (mean)
Time per request:       0.142 [ms] (mean, across all concurrent requests)
Transfer rate:          8681.10 [Kbytes/sec] received

Connection Times (ms)
              min  mean[+/-sd] median   max
Connect:        0   17 122.8      2    3038
Processing:     4   19   5.7     18     231
Waiting:        0    8   6.6      7     225
Total:         10   36 123.1     19    3056

Percentage of the requests served within a certain time (ms)
  50%     19
  66%     21
  75%     23
  80%     24
  90%     27
  95%     28
  98%     31
  99%   1022
 100%   3056 (longest request)


 Server Software:        2.7.0-fiber-pool FREE_STACKS=1
 Server Hostname:        localhost
 Server Port:            9292

 Document Path:          /small
 Document Length:        1200 bytes

 Concurrency Level:      256
 Time taken for tests:   14.676 seconds
 Complete requests:      100000
 Failed requests:        0
 Total transferred:      126000000 bytes
 HTML transferred:       120000000 bytes
 Requests per second:    6813.71 [#/sec] (mean)
 Time per request:       37.571 [ms] (mean)
 Time per request:       0.147 [ms] (mean, across all concurrent requests)
 Transfer rate:          8384.06 [Kbytes/sec] received

 Connection Times (ms)
               min  mean[+/-sd] median   max
 Connect:        0   17 124.6      1    1030
 Processing:     4   20   9.3     18     416
 Waiting:        0    8  10.0      7     412
 Total:          7   37 126.9     20    1437

 Percentage of the requests served within a certain time (ms)
   50%     20
   66%     22
   75%     23
   80%     24
   90%     27
   95%     29
   98%     35
   99%   1027
  100%   1437 (longest request)


	Server Software:        2.7.0-master
	Server Hostname:        localhost
	Server Port:            9293

	Document Path:          /small
	Document Length:        1200 bytes

	Concurrency Level:      256
	Time taken for tests:   16.170 seconds
	Complete requests:      100000
	Failed requests:        0
	Total transferred:      126000000 bytes
	HTML transferred:       120000000 bytes
	Requests per second:    6184.15 [#/sec] (mean)
	Time per request:       41.396 [ms] (mean)
	Time per request:       0.162 [ms] (mean, across all concurrent requests)
	Transfer rate:          7609.41 [Kbytes/sec] received

	Connection Times (ms)
	              min  mean[+/-sd] median   max
	Connect:        0   19 133.4      1    3223
	Processing:     4   22   7.4     21     432
	Waiting:        0    9   8.3      8     422
	Total:          5   41 134.3     22    3246

	Percentage of the requests served within a certain time (ms)
	  50%     22
	  66%     23
	  75%     25
	  80%     27
	  90%     31
	  95%     33
	  98%     39
	  99%   1029
	 100%   3246 (longest request)


	 Server Software:        2.6.3
	 Server Hostname:        localhost
	 Server Port:            9294

	 Document Path:          /small
	 Document Length:        1200 bytes

	 Concurrency Level:      256
	 Time taken for tests:   15.600 seconds
	 Complete requests:      100000
	 Failed requests:        0
	 Total transferred:      126000000 bytes
	 HTML transferred:       120000000 bytes
	 Requests per second:    6410.16 [#/sec] (mean)
	 Time per request:       39.937 [ms] (mean)
	 Time per request:       0.156 [ms] (mean, across all concurrent requests)
	 Transfer rate:          7887.51 [Kbytes/sec] received

	 Connection Times (ms)
	               min  mean[+/-sd] median   max
	 Connect:        0   18 130.2      1    3132
	 Processing:     4   21   8.4     20     432
	 Waiting:        0    9   9.2      8     428
	 Total:          9   39 131.6     21    3143

	 Percentage of the requests served within a certain time (ms)
	   50%     21
	   66%     22
	   75%     23
	   80%     25
	   90%     31
	   95%     33
	   98%     34
	   99%   1029
	  100%   3143 (longest request)
Updated by ioquatix (Samuel Williams) almost 7 years ago
There is some kind of performance regression in 2.6.3 -> 2.7.0-master.
So, I'm trying with 2.7.0-preview1 to see if it's better or worse.
Server Software:
Server Hostname:        localhost
Server Port:            9294

Document Path:          /small
Document Length:        1200 bytes

Concurrency Level:      256
Time taken for tests:   17.464 seconds
Complete requests:      100000
Failed requests:        0
Total transferred:      126000000 bytes
HTML transferred:       120000000 bytes
Requests per second:    5726.11 [#/sec] (mean)
Time per request:       44.708 [ms] (mean)
Time per request:       0.175 [ms] (mean, across all concurrent requests)
Transfer rate:          7045.80 [Kbytes/sec] received

Connection Times (ms)
              min  mean[+/-sd] median   max
Connect:        0   20 137.8      1    1029
Processing:     4   24   7.8     21     428
Waiting:        0   10   8.5      9     420
Total:          4   44 138.5     23    1452

Percentage of the requests served within a certain time (ms)
  50%     23
  66%     24
  75%     28
  80%     30
  90%     34
  95%     36
  98%     45
  99%   1032
 100%   1452 (longest request)
2.7.0-preview1 is much worse, relatively speaking.
Updated by ioquatix (Samuel Williams) almost 7 years ago
- Status changed from Open to Closed
- Target version set to 2.7
It was merged.
") Updated by methodmissing (Lourens Naudé) almost 7 years ago
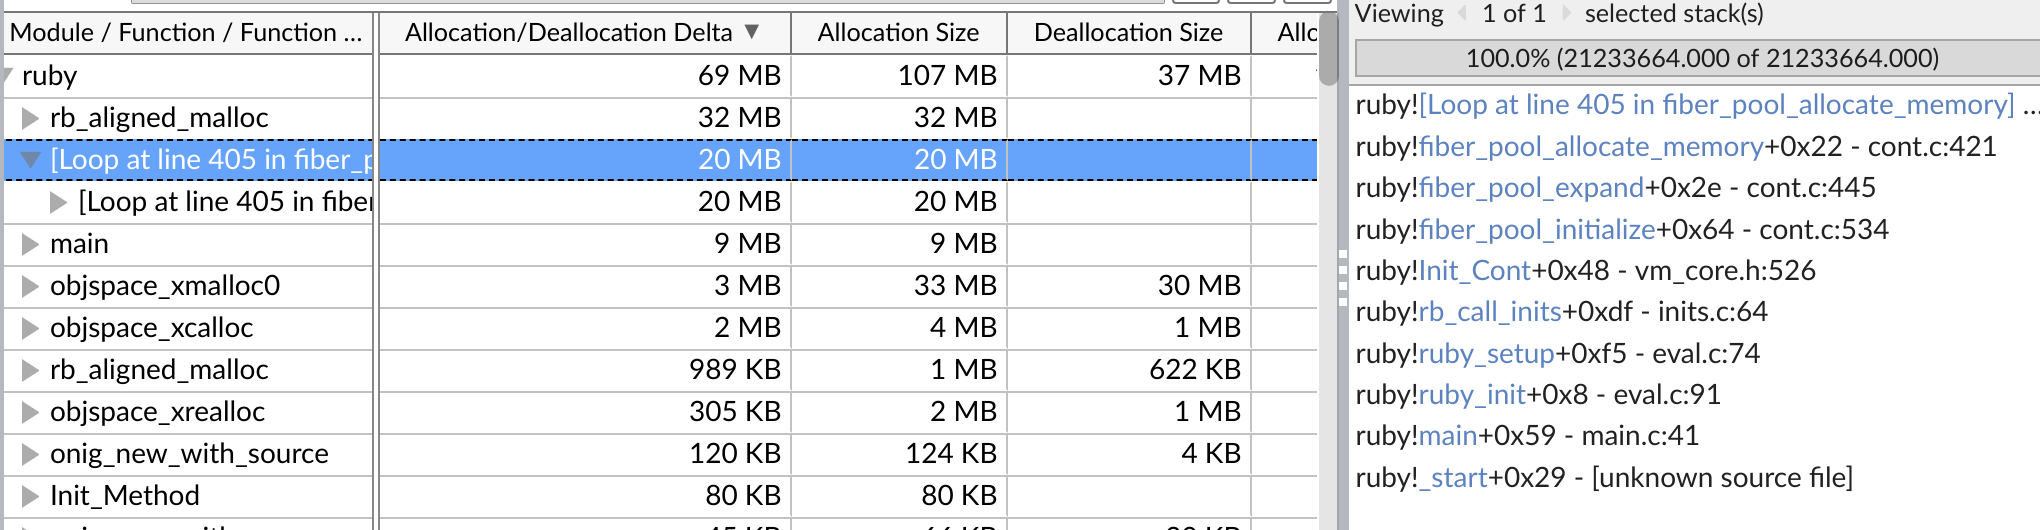
Updated by methodmissing (Lourens Naudé) almost 7 years ago
ioquatix (Samuel Williams) wrote:
It was merged.
Hi Samuel excellent work. I'm just wondering about the 20MB pool size noticeable across a few different application types with the fiber pool changes. And the ruby teardown sequence ideally needs to clean up too.