Feature #14857
closedcollect malloc info
Description
Abstract
Collect malloc (related) information to measure malloc behavior.
Introduce USE_GC_MALLOC_OBJ_INFO_DETAILS macro to enable malloc info.
Collected information:
- gen (GC count at allocation)
- file (C file name)
- line (C line number at the file)
Statistics with collected data are dumped at the end of interpreter process.
Background
MRI heap is managed by two level: GC heap and malloc heap.
malloc'ed memory objects are not surveyed well. This patch will provide the way to survey.
Design
If we turn on USE_GC_MALLOC_OBJ_INFO_DETAILS in include/ruby/defines.h, replace ruby_xmalloc with ruby_xmalloc_with_location with __FILE__ and __LINE__ information.
Passed location information is stored into global variables ruby_malloc_info_file and ruby_malloc_info_line.
If we turn off USE_GC_MALLOC_OBJ_INFO_DETAILS, then there are no difference compare with current implementation.
At the end of interpreter process, statistics information are dumped (see below).
Note: Global variables are dirty hack to propagate information with multi-threading but these information are hint so it will not so big issue for now.
Note: Storing __FILE__ information can be danger with dlclose.
Note: Now it uses __attribute__((destructor)) so only gcc (and compatible compilers) are supported.
Note: Current statistics is temporary. Using fprintf to stderr, line information is not used, ...
Result
For example we can collect the following data with make gcbench-rdoc.
* malloc_info gen statistics
0       4013681 837323416
1       7762641 2020466856
2       445361  73306928
3       292103  36684616
4       8139    2390184
5       25474   4555744
6       80905   10930904
7       39240   4827424
8       69      11768
9       24054   3852608
10      172233  28140136
11      90142   16514176
12      8250    1539984
13      58602   12782816
14      31      515624
15      174     35760
16      15      225176
17      50      27104
18      40      16656
19      16      8288
20      24      32544
21      33      7736
22      35      18008
23      64      2108464
24      64      15024
25      3       463040
26      3       616
27      17      5944
28      24      4192
29      26      4736
30      34      9216
31      49      9624
32      42      7744
33      50      10928
34      11      16072
35      22      10960
36      22      4496
37      28      5200
38      25      4632
39      17      3128
40      8       2864
41      2       208
42      4       512
43      10      2816
44      0       0
45      0       0
46      7       632
47      15      2760
48      10      3296
49      11      3976
50      12      2176
51      5       920
52      4       688
53      0       0
54      4       14688
55      8       1472
56      5       1160
57      4       1232
58      3       456
59      1       184
60      2       288
61      5       776
62      15      2168
63      0       0
64      9       1656
65      0       0
66      3       472
67      9       1672
68      7       1288
69      5       952
70      9       1672
71      2       368
72      4       736
73      1       264
74      7       1256
75      10      1824
76      0       0
77      7       1080
78      1       200
79      4       544
80      2       368
81      2       368
82      1       184
83      3       712
84      3       552
85      6       992
86      4       720
87      6       1152
88      4       229824
89      24      4448
90      4       704
91      1       152
92      7       1304
93      4       640
94      10      1712
95      7       1304
96      2       384
97      6       1104
98      15      2808
more    1367    1100544
* malloc_info size statistics
16      1
32      0
64      110351
128     7179056
256     5218641
512     191488
1024    132416
2048    90759
4096    27288
8192    25217
more    48287
* malloc_info file statistics
../../clean-trunk/st.c  6075152 787649608
../../clean-trunk/id_table.c    3941    562104
../../clean-trunk/class.c       1233    94328
../../clean-trunk/string.c      1783235 1332458472
../../clean-trunk/iseq.c        6362    3008848
../../clean-trunk/iseq.h        4718    872288
../../clean-trunk/compile.c     37515   17862680
../../clean-trunk/array.c       2905287 500079152
../../clean-trunk/util.c        495     30744
../../clean-trunk/parse.y       28338   2315840
../../clean-trunk/node.c        3580    29669904
../../clean-trunk/variable.c    497334  37234384
../../clean-trunk/io.c  34116   126914272
../../clean-trunk/vm_method.c   386     27856
../../clean-trunk/gc.c  64633   5511736
../../clean-trunk/re.c  483009  42745464
../../clean-trunk/vm.c  5173    399272
../../clean-trunk/vm_backtrace.c        13934   8510560
../../clean-trunk/file.c        16550   3051920
ripper.y        71243   5743368
../../clean-trunk/struct.c      985964  72657200
../../clean-trunk/cont.c        1218    80875792
../../clean-trunk/error.c       1       56
../../clean-trunk/object.c      85      13432
(null)  1       0
../../clean-trunk/signal.c      1       16424
malloc_info gen statistics
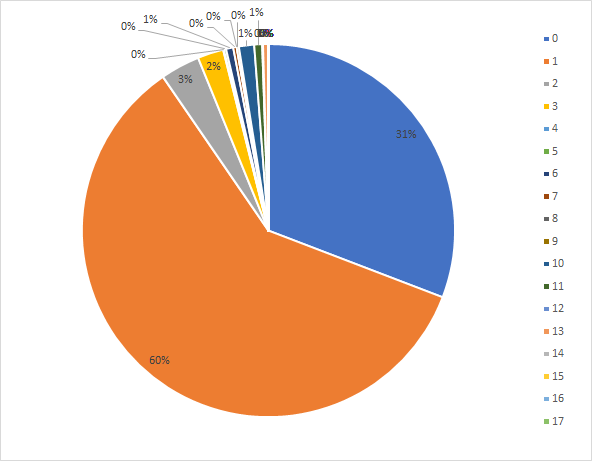
"gen" is "generation", counted by GC count. It shows object lifetime. If object created at "gen == rb_gc_count() == 30" and the object free-ed at 33, then the age is 3 (33-30).
The following table shows malloc object lifetime statistics.
0       4013681 837323416
1       7762641 2020466856
2       445361  73306928
3       292103  36684616
4       8139    2390184
5       25474   4555744
6       80905   10930904
...
columns shows "age", "malloc-ed count" and "malloc'ed total size".

This figure shows picharts using 0 and 1 columns.
Checking 0 and 1, most of malloc objects are live within 0 or 1 age. It proofs generational GC ideas too.
malloc_info size statistics
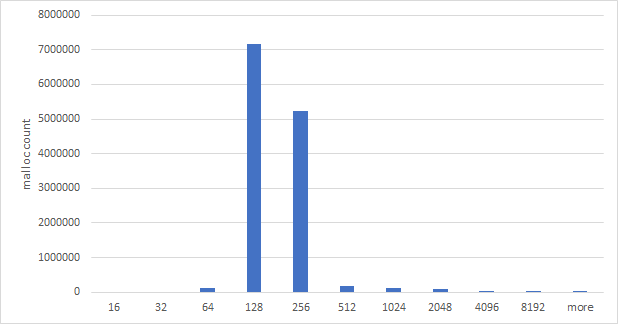
This table shows "size - count" statistics.
16      1
32      0
64      110351
128     7179056
256     5218641
...
The first column is malloc'ed size range (16 for 0-16, 32 for 17-32, ...) and the second column shows malloc'ed count when required size is in the size range.
For example, when malloc(100) is called, then "128" line is incremented.

As you can see, this example shows most of malloc'ed size are 65 to 256.
malloc_info file statistics
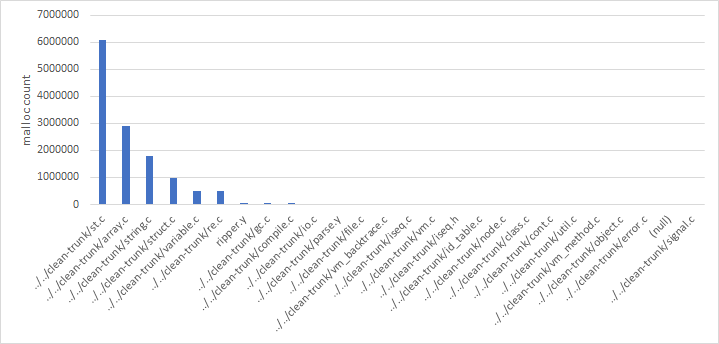
This statistics shows which file allocate the malloc'ed objects.

On RDoc example, we can see st, array, string are dominant (maybe same as other app. I wonder that string is not top).
How to use
You need to install your own Ruby with turning on USE_GC_MALLOC_OBJ_INFO_DETAILS.
You need to rebuild all C-extensions installed by gems.
Call for your results
I'll commit this patch soon. If you have spare time and you have a good app to measure, please tell us your results.
Thanks,
Koichi
Files