Bug #21696
closed")
Performance degradation for long running processes in Ruby 4.0.0-preview2
Description
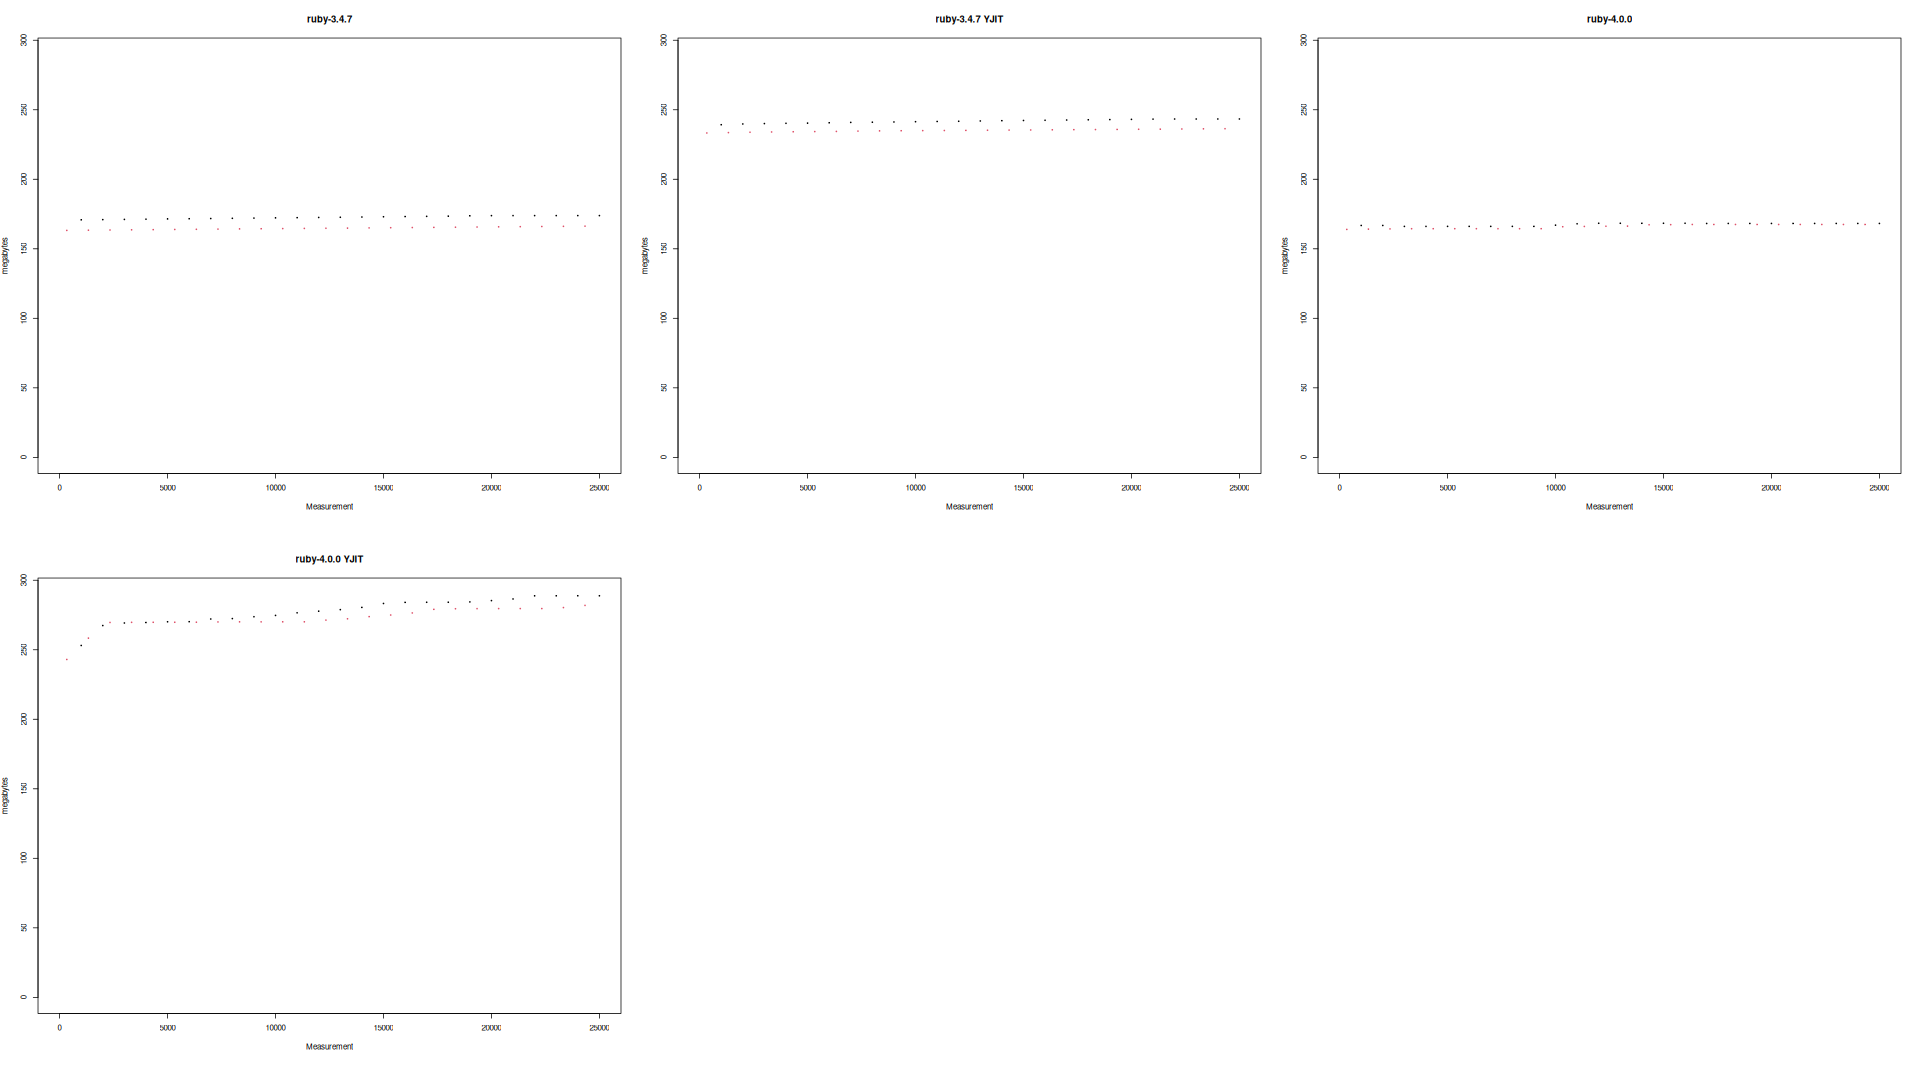
When running my RubyMeasureResponsetime tool (https://github.com/easydatawarehousing/ruby_measure_responsetime) on Ruby 4.0.0-preview2, a slow but steady performance degradation is measurable.
Both the Rails and the Roda based test applications show this. And both with and without yjit.
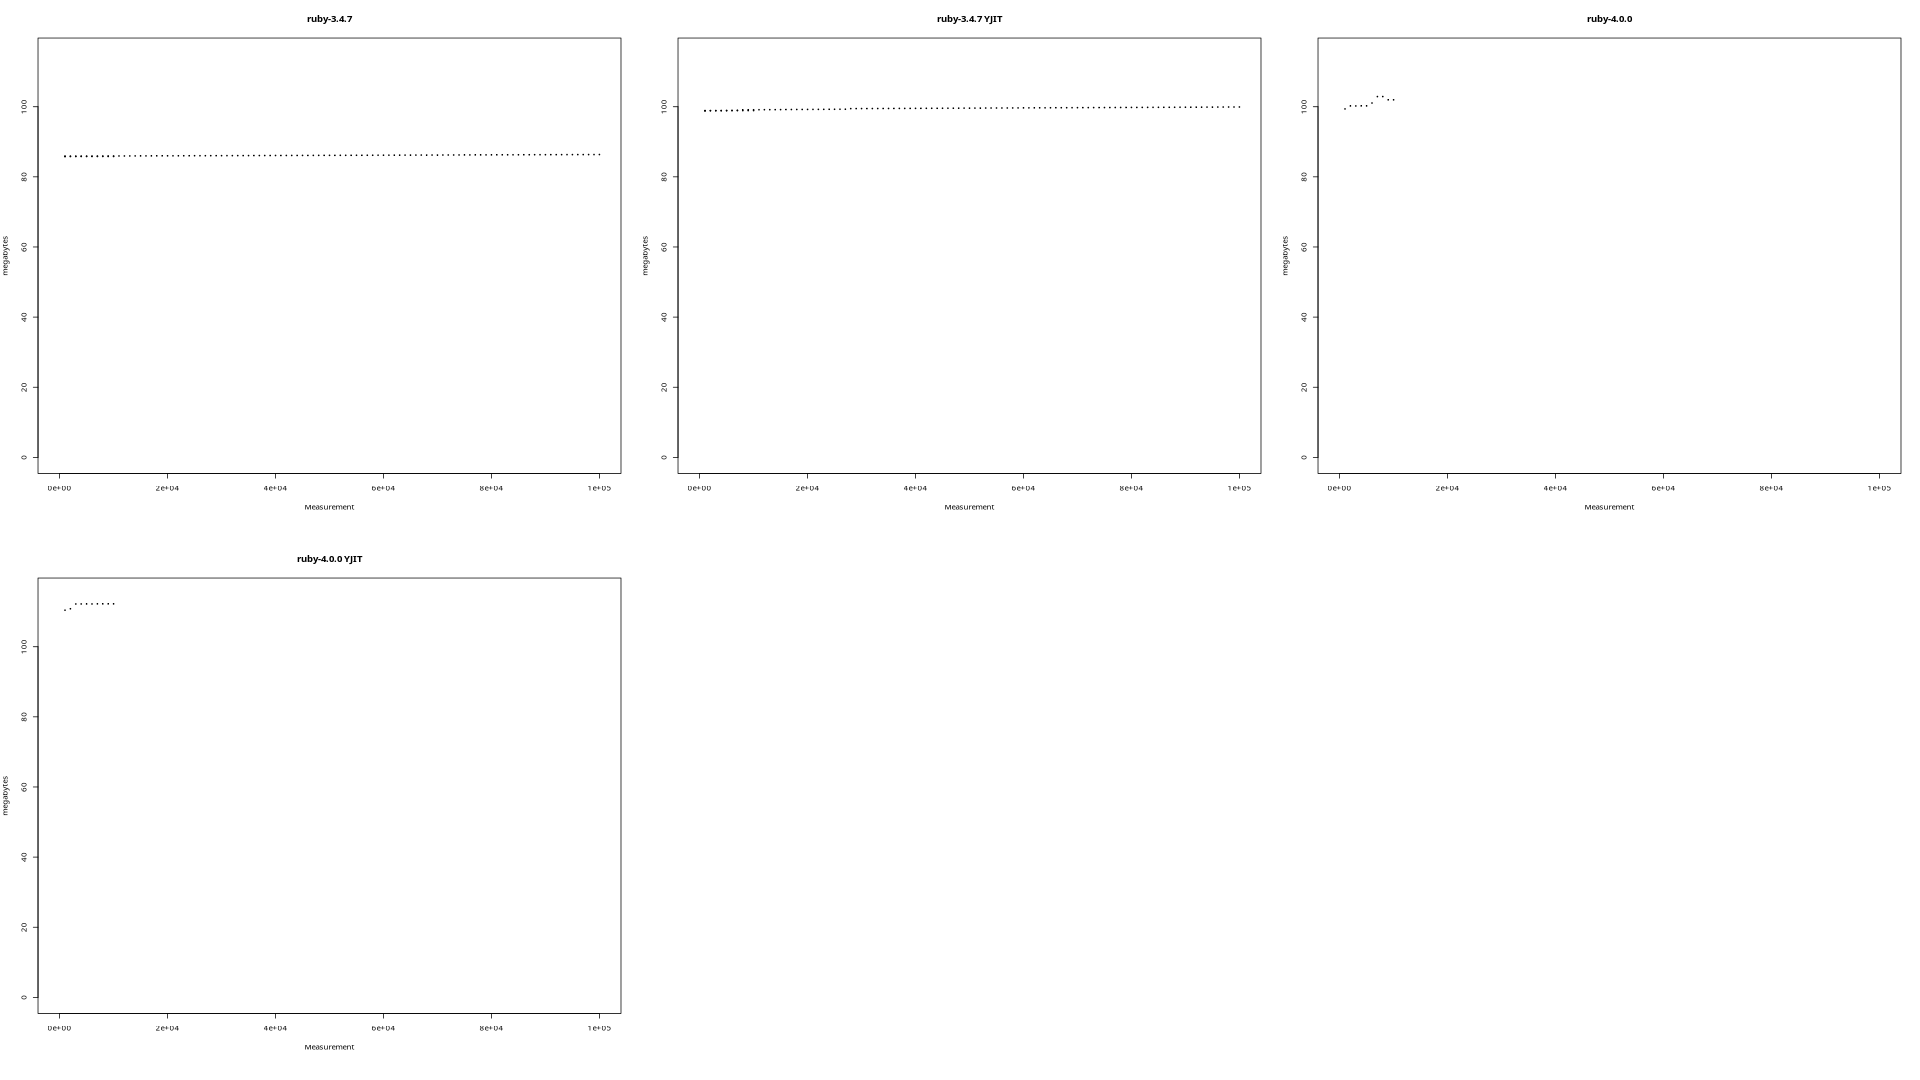
The Rails application when using yjit also seems to have increasing memory usage over time.
Running the same tests on Ruby 3.4.7 shows stable performance and memory usage.
I have included some plots showing this behavior.
Files
") Updated by ufuk (Ufuk Kayserilioglu) 4 months ago
Updated by ufuk (Ufuk Kayserilioglu) 4 months ago
Did 3.5-preview1 have the same behaviour? If not, could you bisect between the two releases to find the commit that changed the behaviour?
") Updated by easydwh (Ivo Herweijer) 4 months ago
Updated by easydwh (Ivo Herweijer) 4 months ago
ufuk (Ufuk Kayserilioglu) wrote in #note-1:
Did 3.5-preview1 have the same behaviour? If not, could you bisect between the two releases to find the commit that changed the behaviour?
Just ran the test, only for the Roda app. Results look very similar (almost identical) to 3.4.7. Logically the culprit should be a commit for 4.0-preview.
I don't know anything about Ruby source code, so pinpointing the commit(s) involved is beyond my knowledge.
") Updated by luke-gru (Luke Gruber) 4 months ago
· Edited
Updated by luke-gru (Luke Gruber) 4 months ago
· Edited
- File rodauth_0_overview.png rodauth_0_overview.png added
- File rodauth_0_memory.png rodauth_0_memory.png added
- File rodauth_1_ruby-3.4.7.png rodauth_1_ruby-3.4.7.png added
- File rodauth_1_ruby-3.4.7 YJIT.png rodauth_1_ruby-3.4.7 YJIT.png added
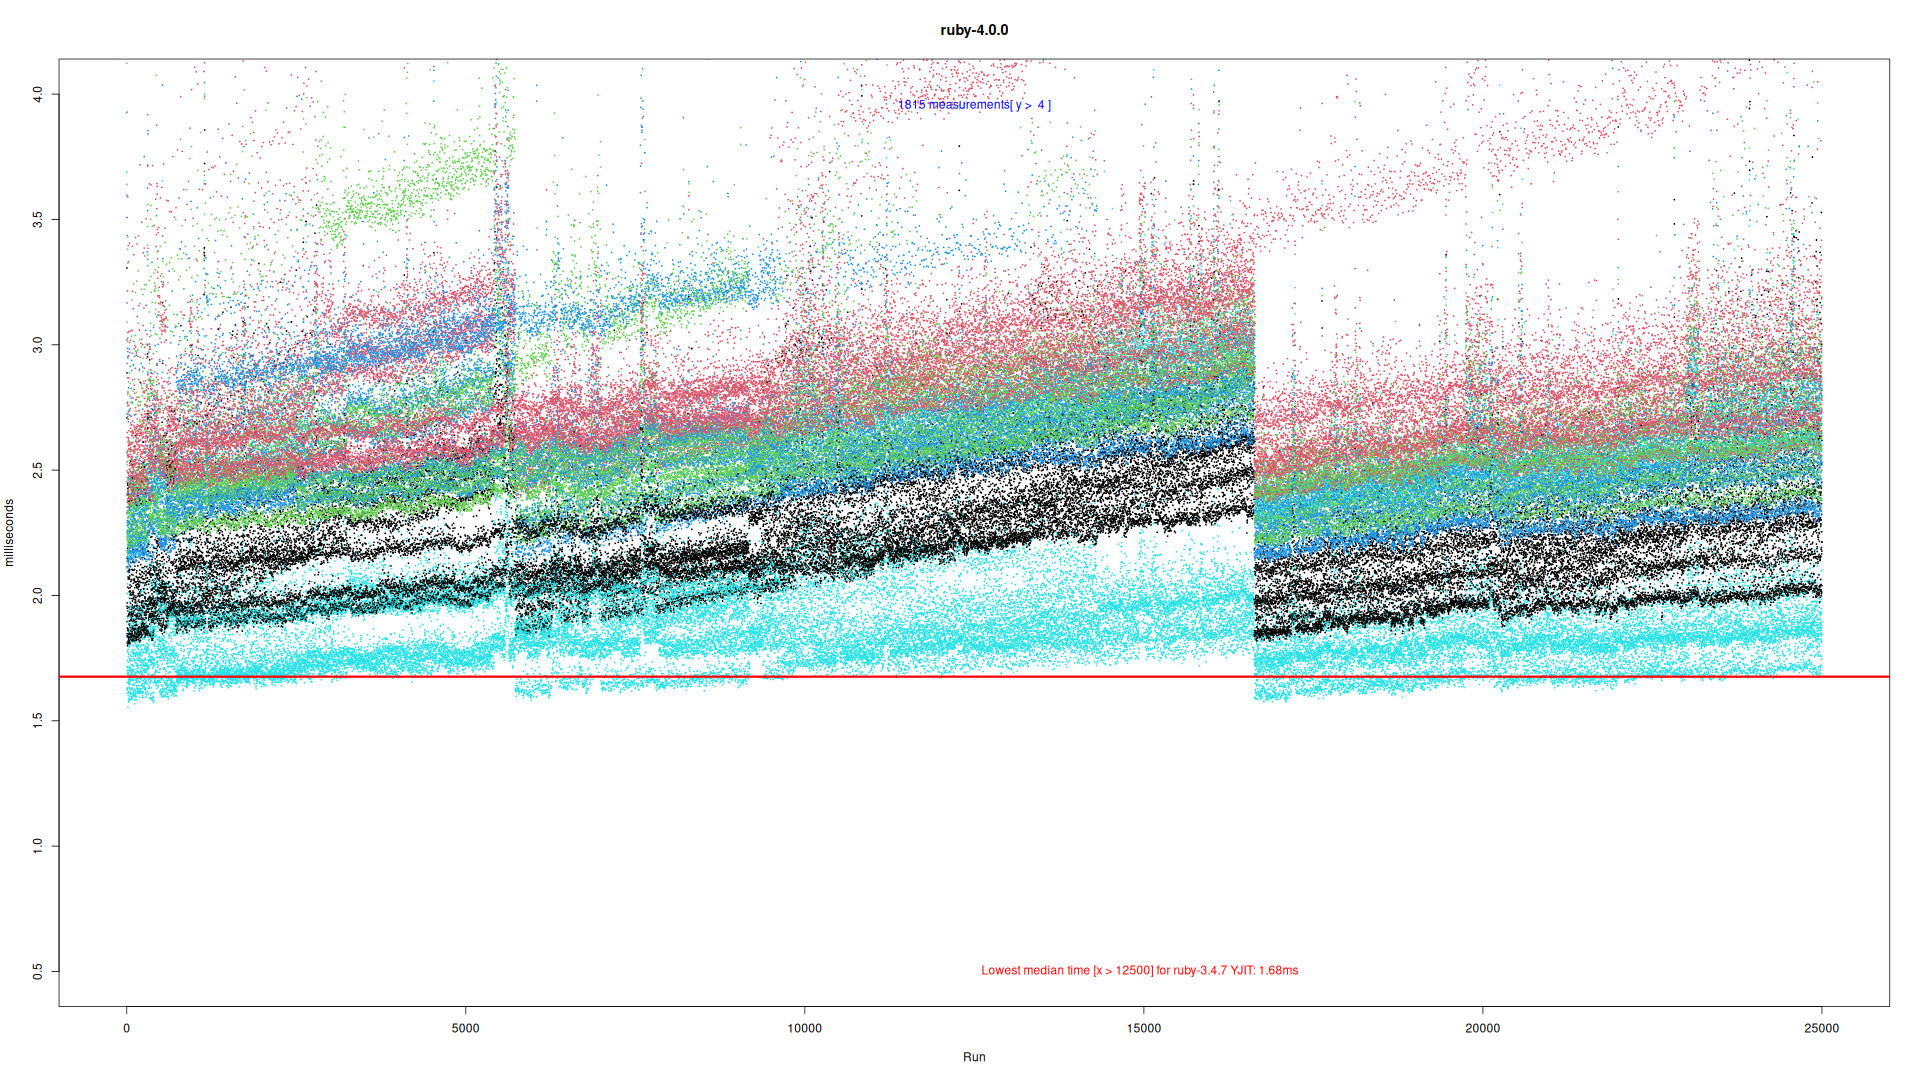
- File rodauth_1_ruby-4.0.0.png rodauth_1_ruby-4.0.0.png added
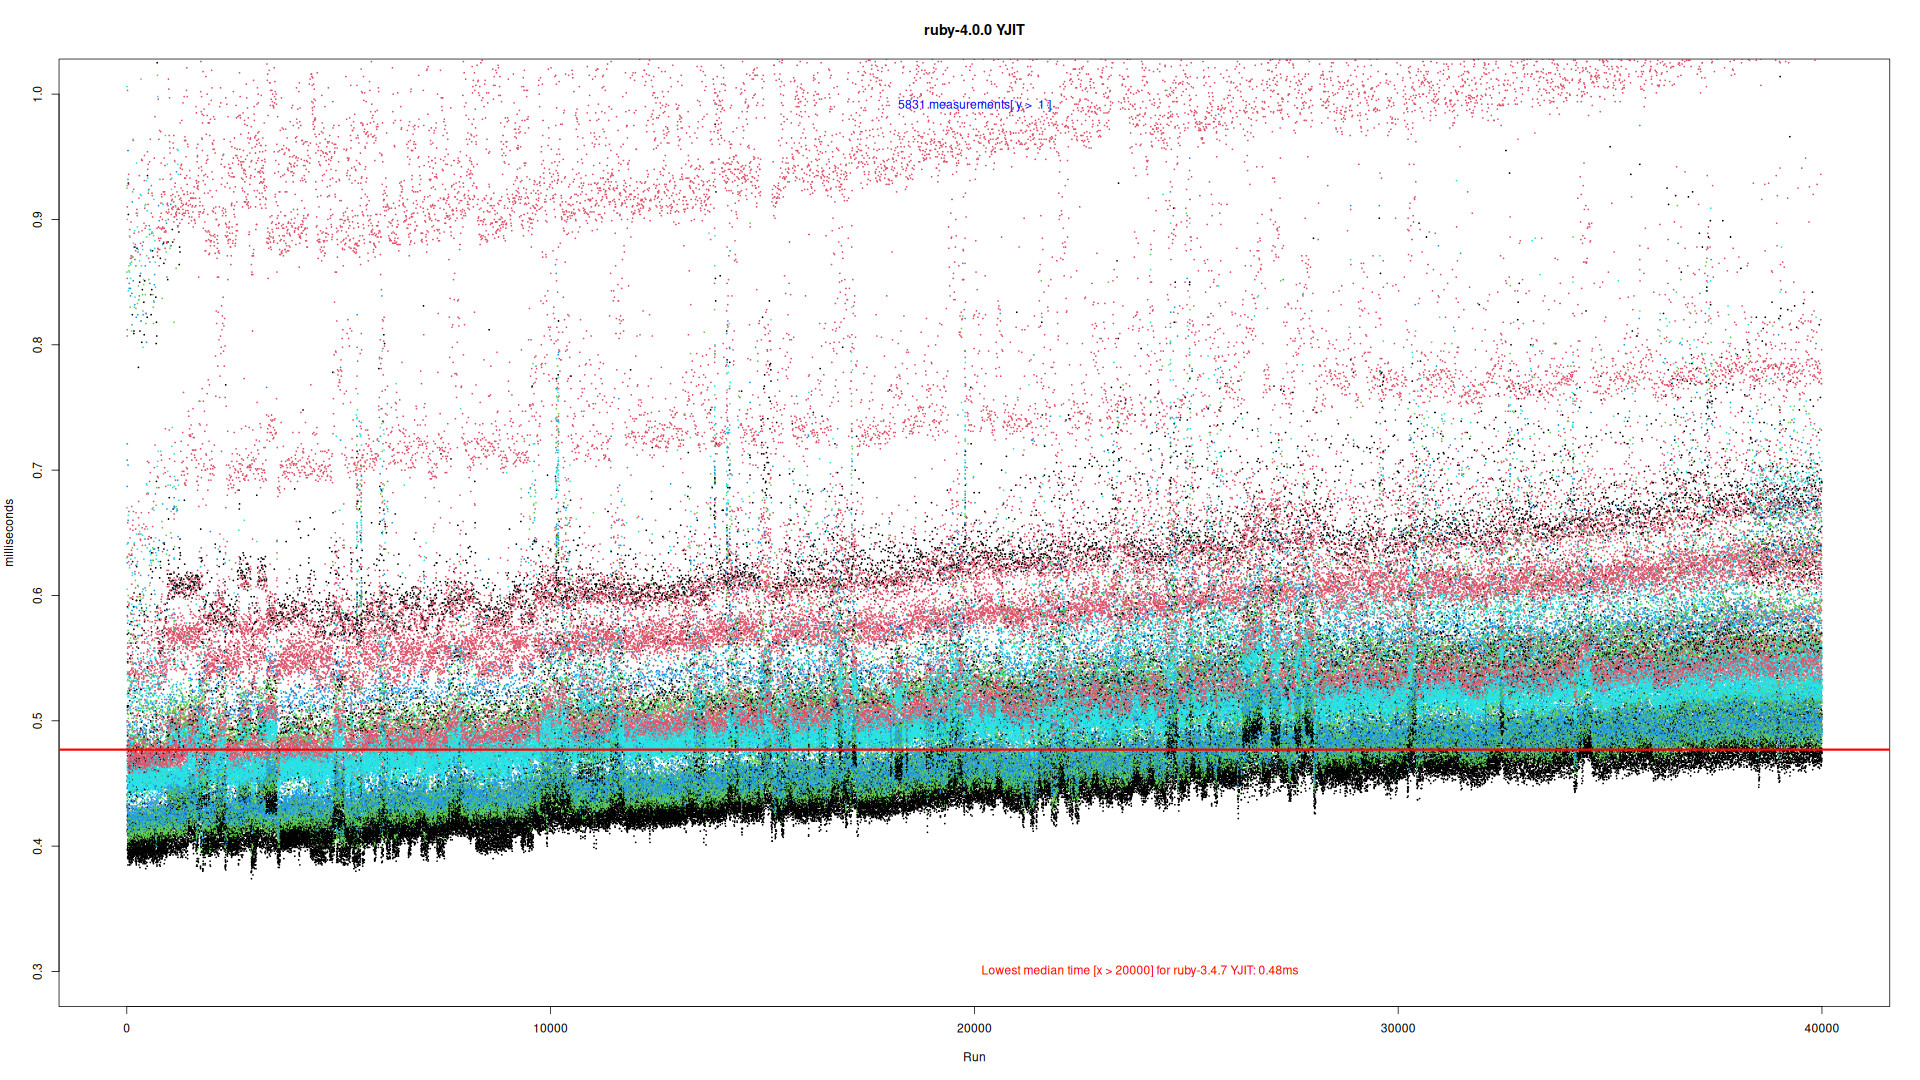
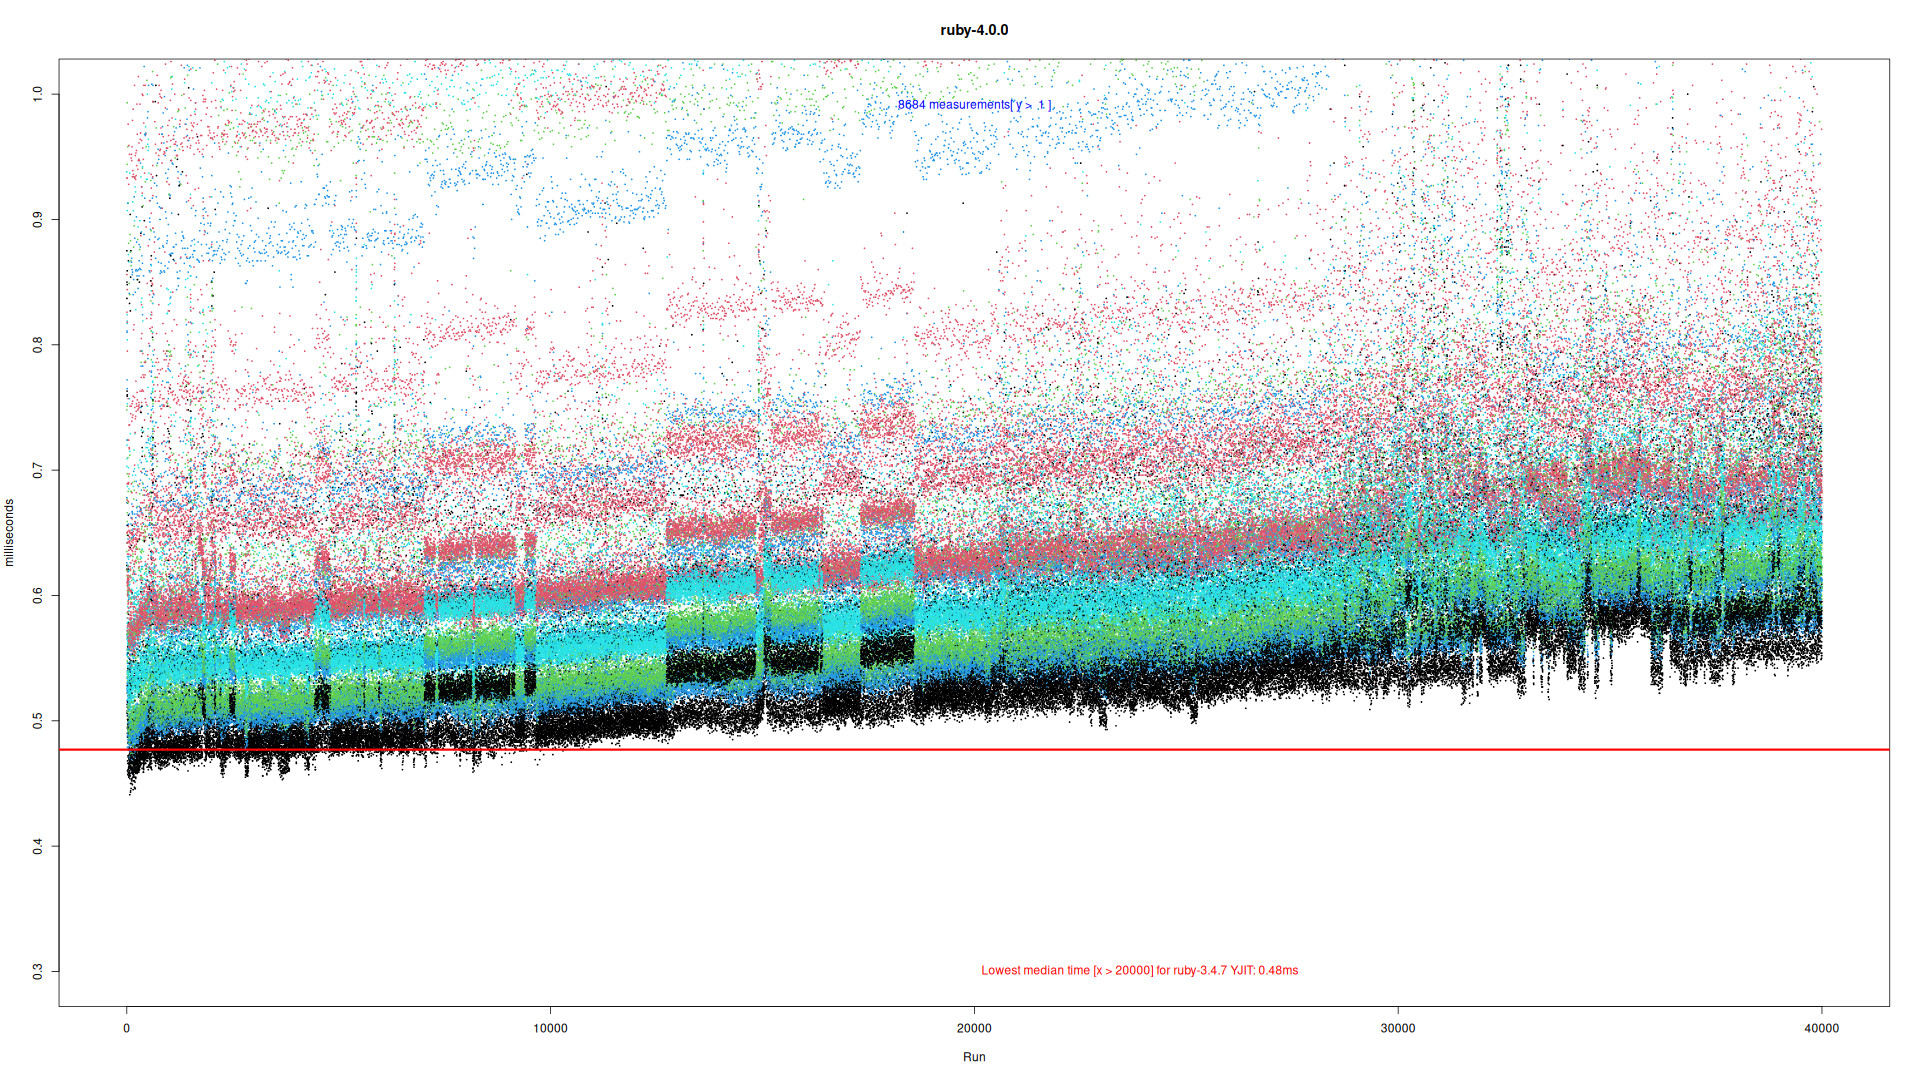
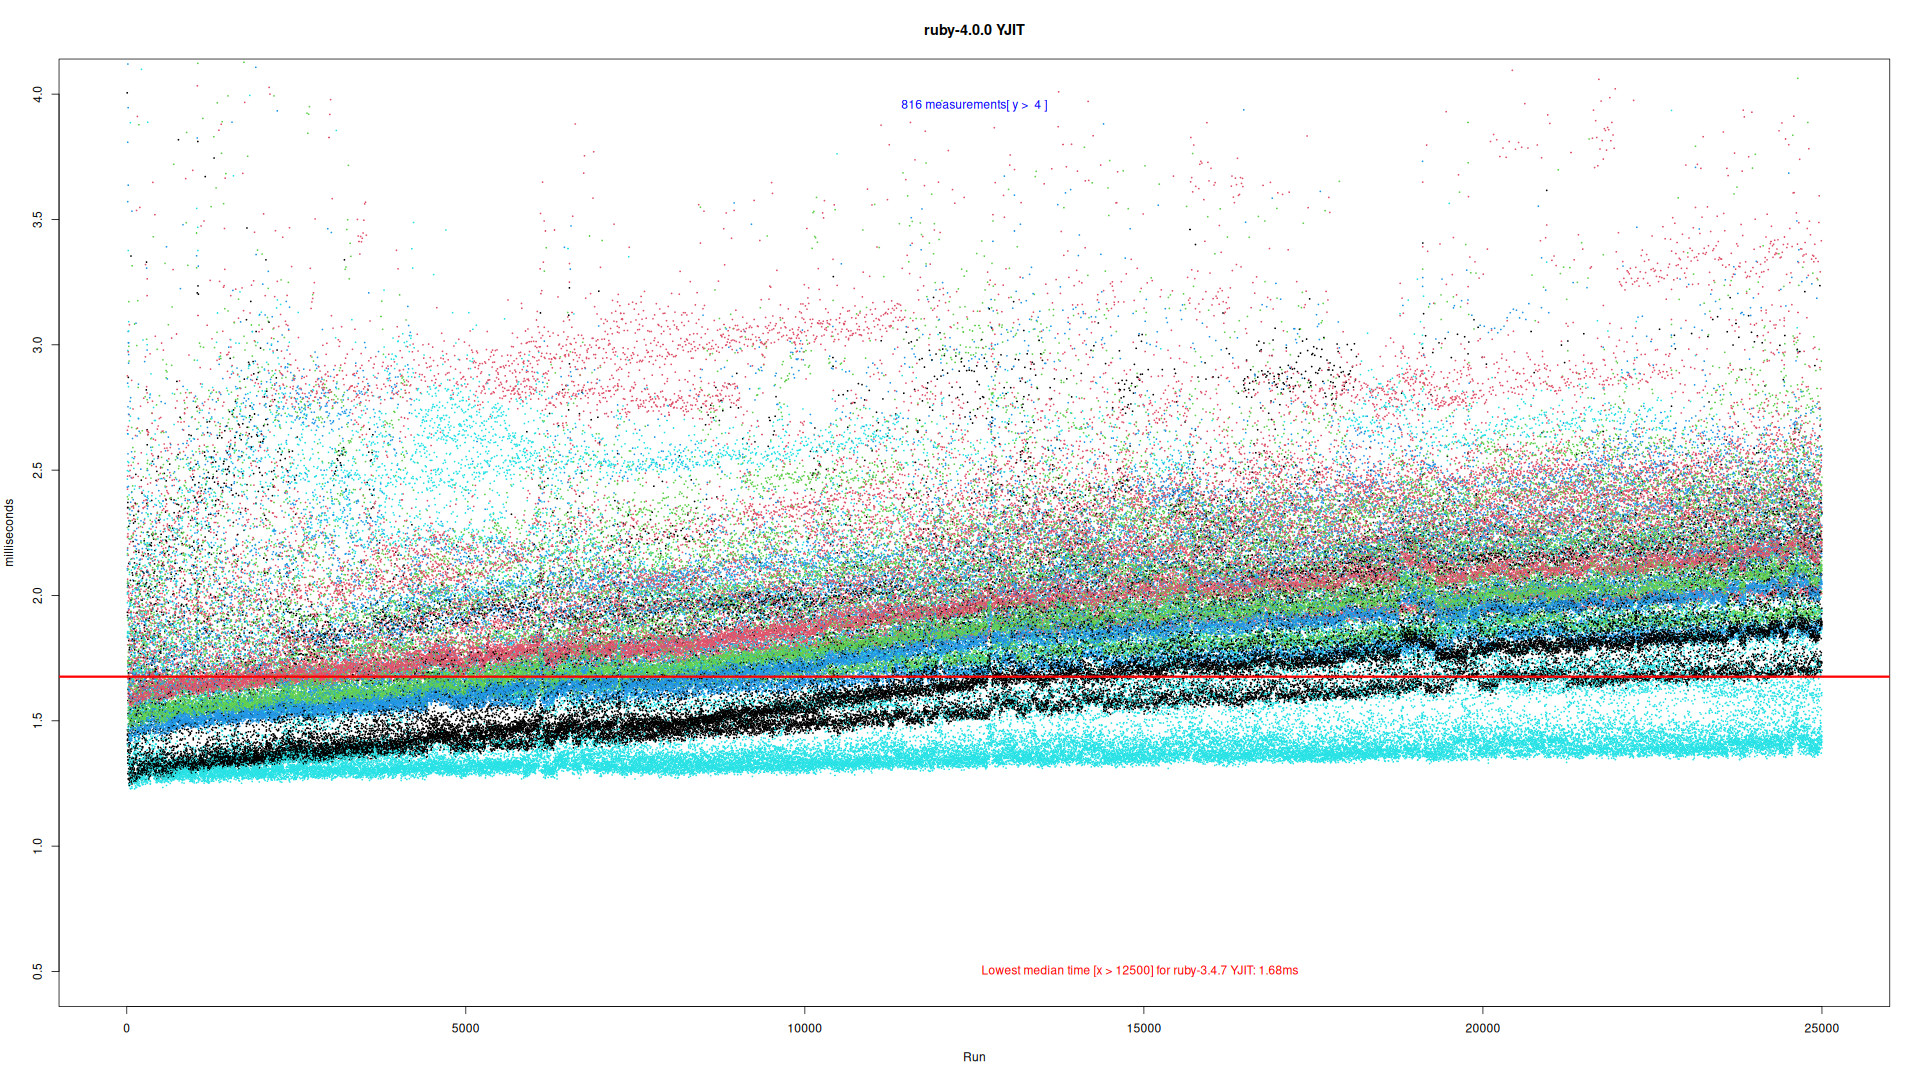
- File rodauth_1_ruby-4.0.0 YJIT.png rodauth_1_ruby-4.0.0 YJIT.png added
I ran the benchmarks, but unfortunately some of the gems are out of date for anyone looking into this. The Gemfile needs:
gem "sqlite3" # instead of "1.4.2"
gem "nio4r", "2.7.5" # instead of "2.5.8"
I also had to create a chruby file in lib/ruby_measure_responsetime/chruby.rb:
# frozen_string_literal: true

class Chruby

  def self.ruby_manager
    if self.ruby_manager_installed?
      self
    end
  end

  def self.installed_rubies
    versions = [["master-release", nil]]
    versions << ["master-release", "--yjit"]
  end

  def self.cmd_initialize_ruby_version_manager; end

  def self.cmd_switch_to_ruby(version)
    "chruby #{version} > /dev/null;"
  end

  private

  def self.ruby_manager_installed?
    true
  end
end
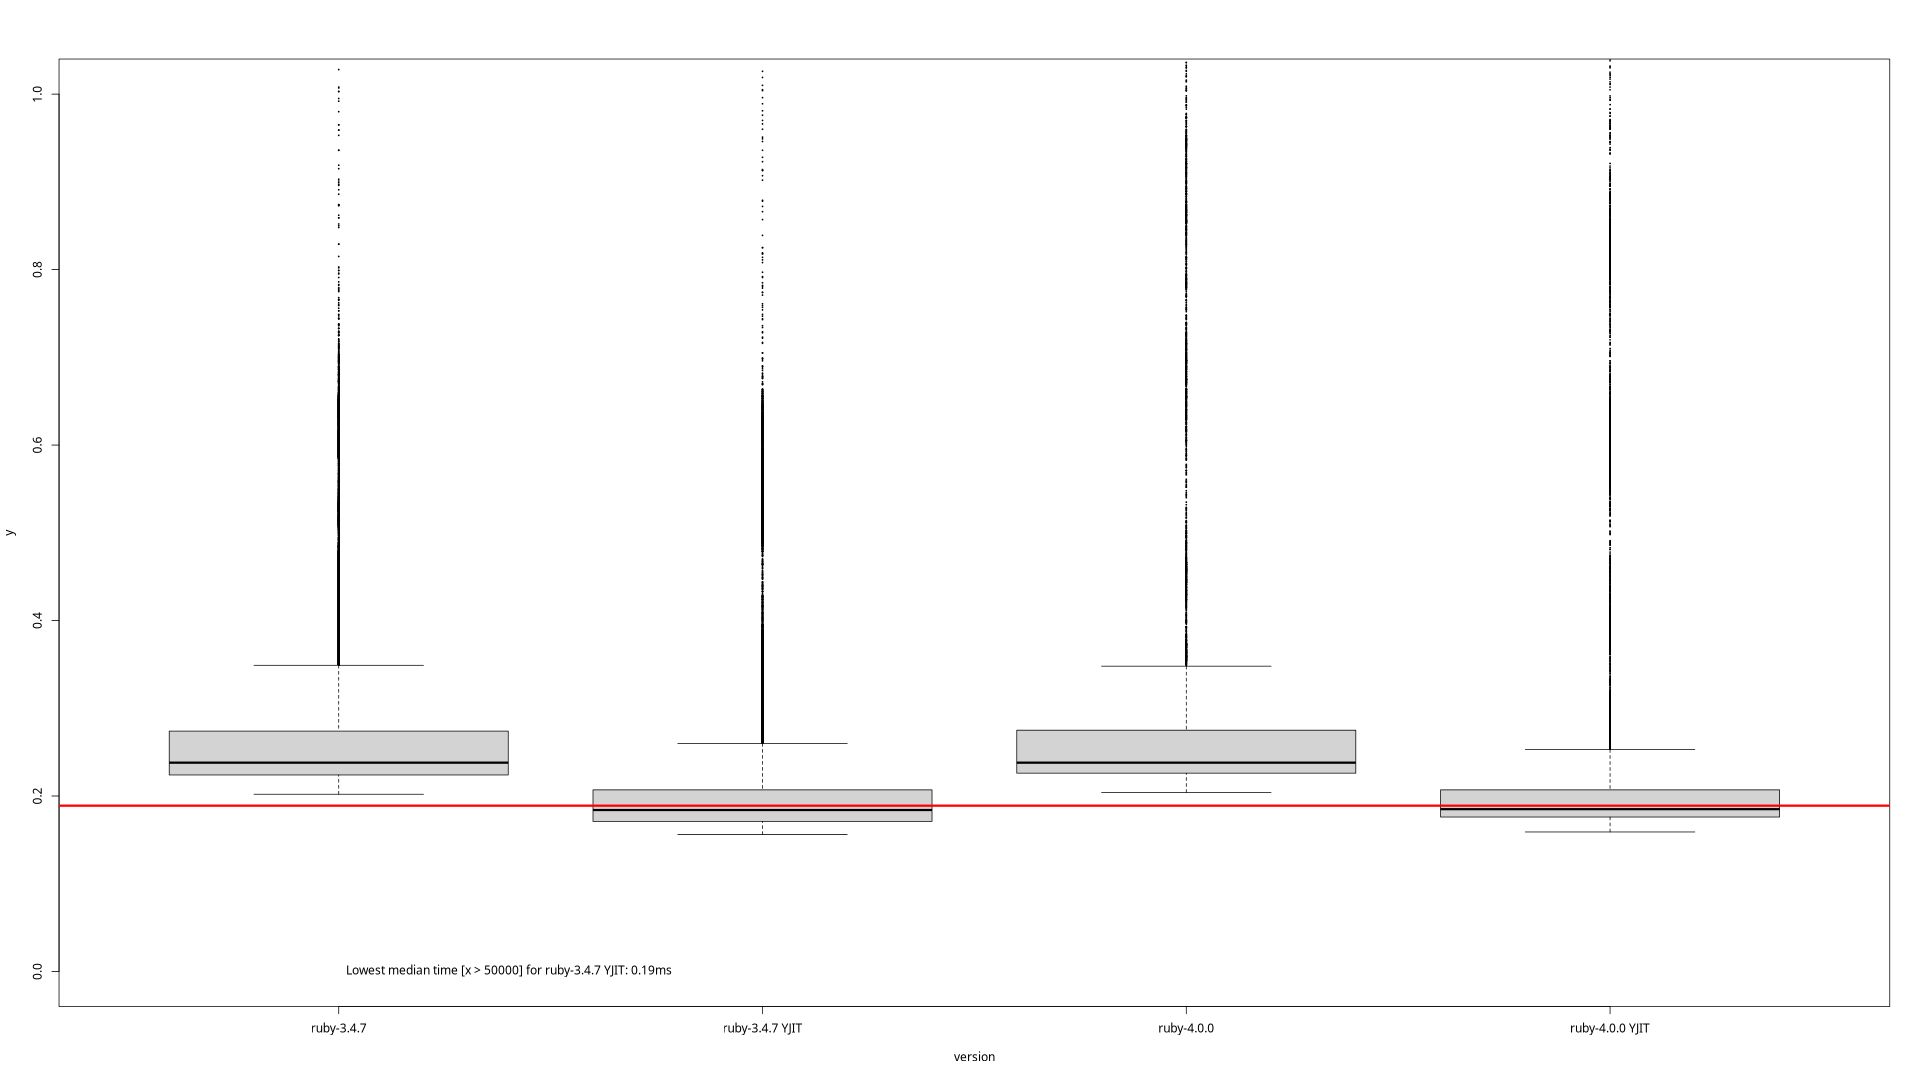
The plot images are attached. What I saw was:
- There is more memory usage with 4.0.0 compared to 3.4.7, but this is expected. We will mention this in the release notes, and we're working on reducing it.
- Running 100k requests doesn't take that long (around 90s on my machine) so it's hard to say anything about performance degradation or memory growth across the lifetime of the process. You would need more data across a longer timeline for this. However, I don't see a reduction in performance according to the images generated from my run. Also they completed in around the same time.
- The memory and histogram graphs are very hard to make out or they didn't work, maybe?. I attached them anyway.
Updated by easydwh (Ivo Herweijer) 4 months ago
Thanks for running the tests!
On my machine (x64 Linux/AMD Ryzen 7 5800X) Roda works fine with the Gemfile from the repository. Yes, most gems are (very) old, I have pinned these in order to have a stable set of gems so comparing results to previous test runs is possible. For the test itself it doesn't really matter if gems are up to date or not as long as they are same for every tested Ruby version.
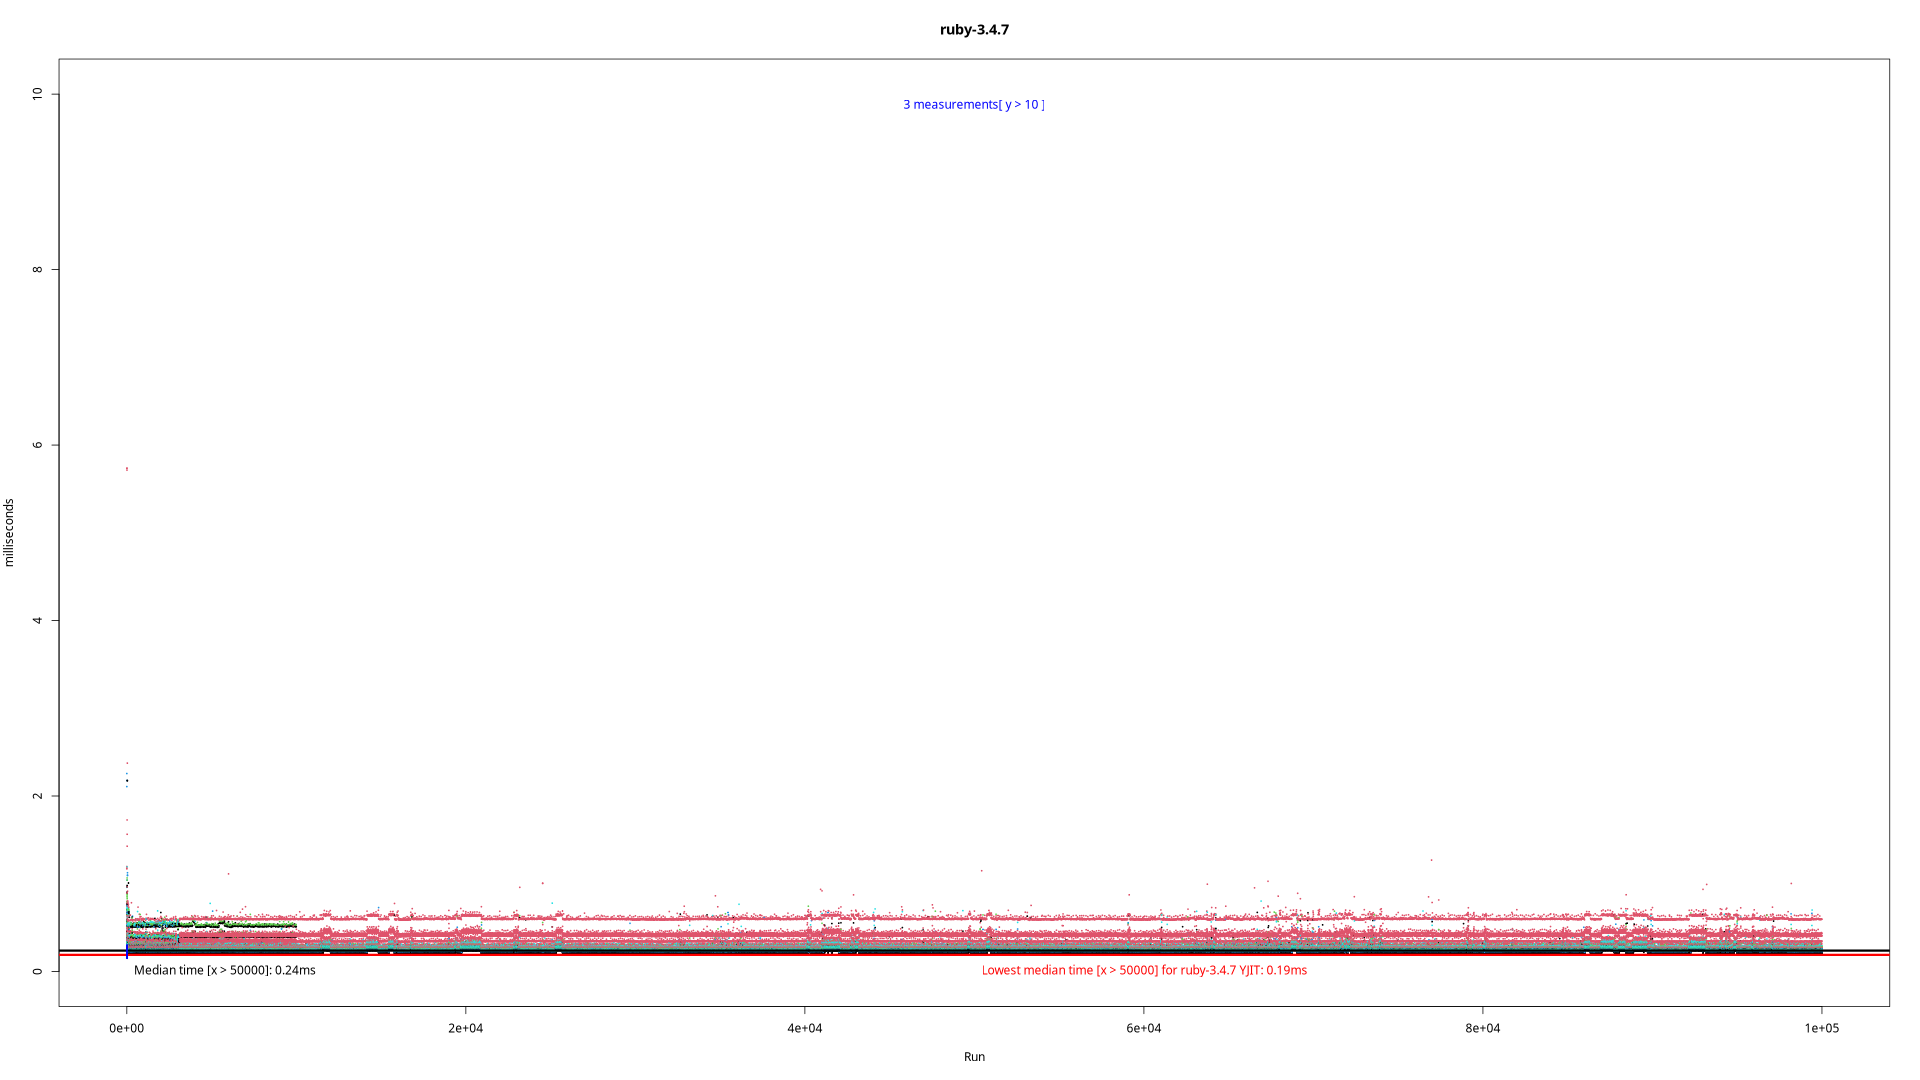
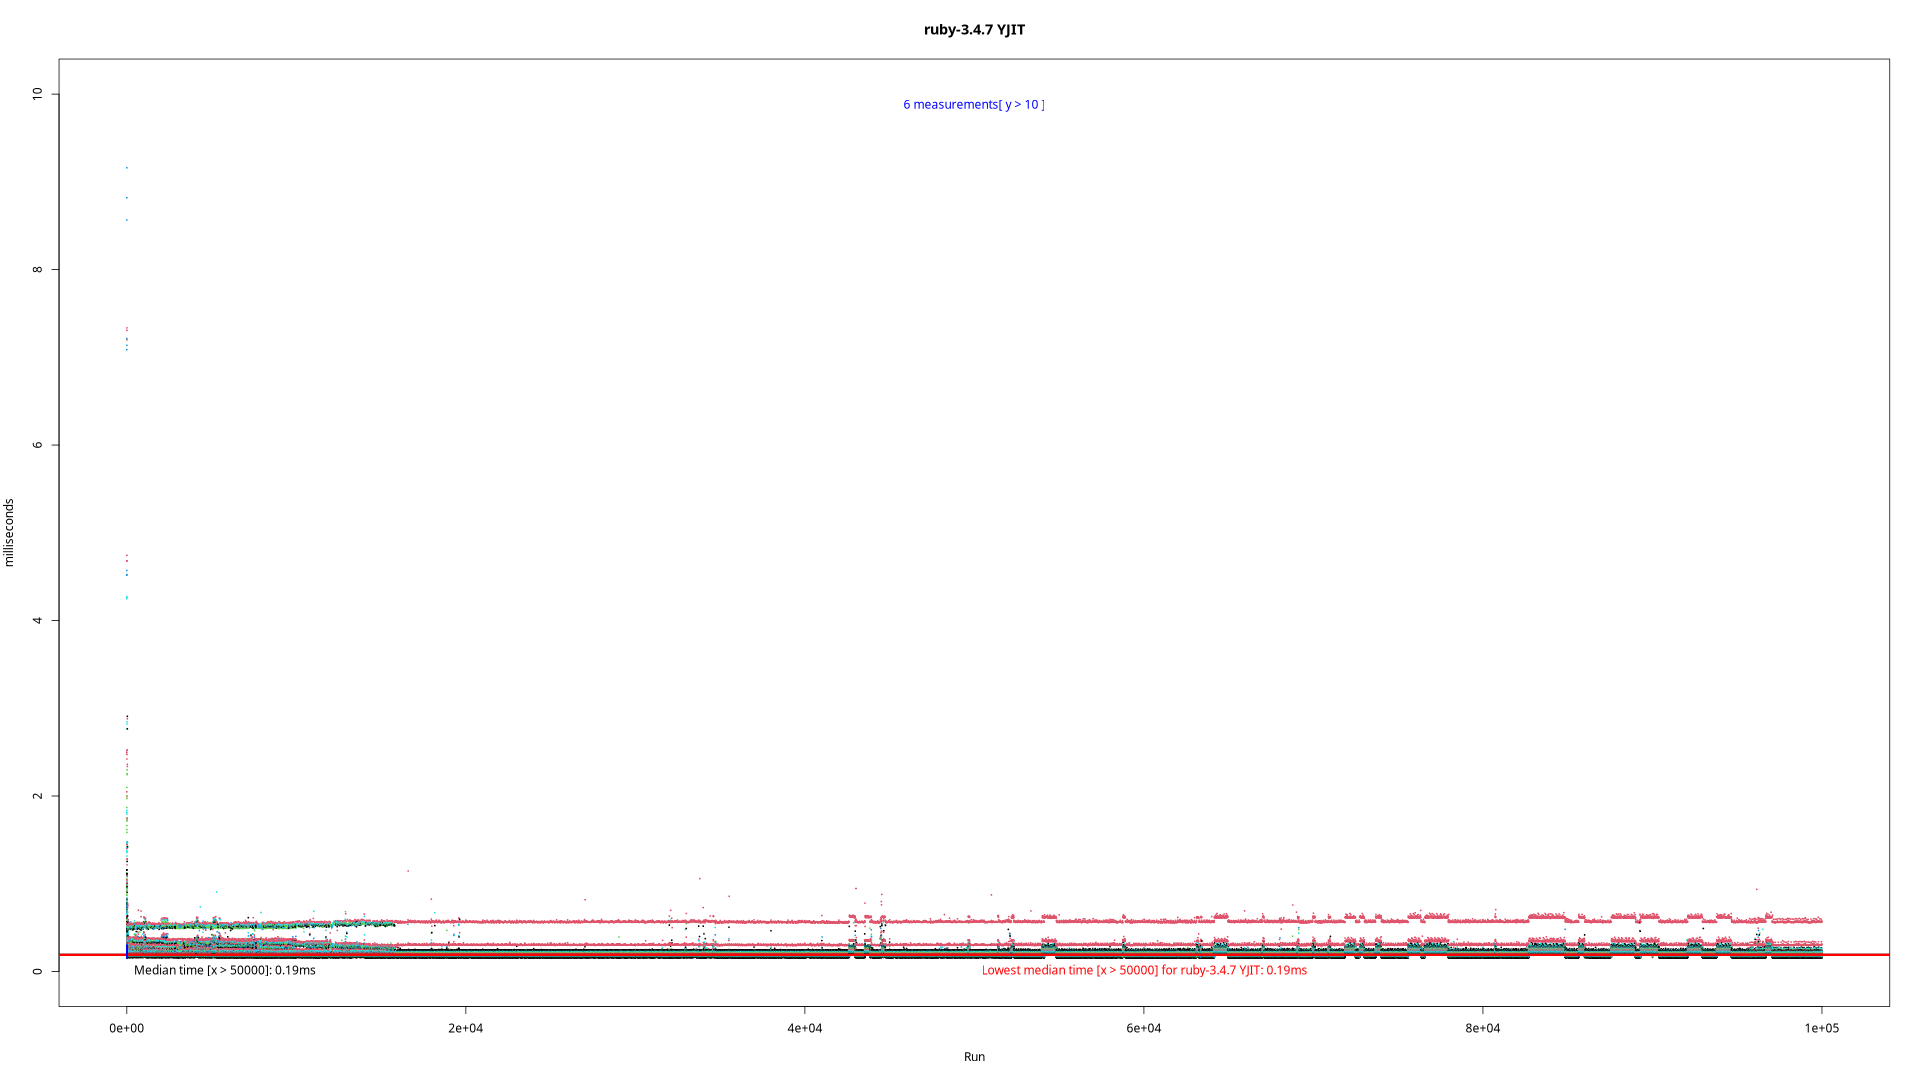
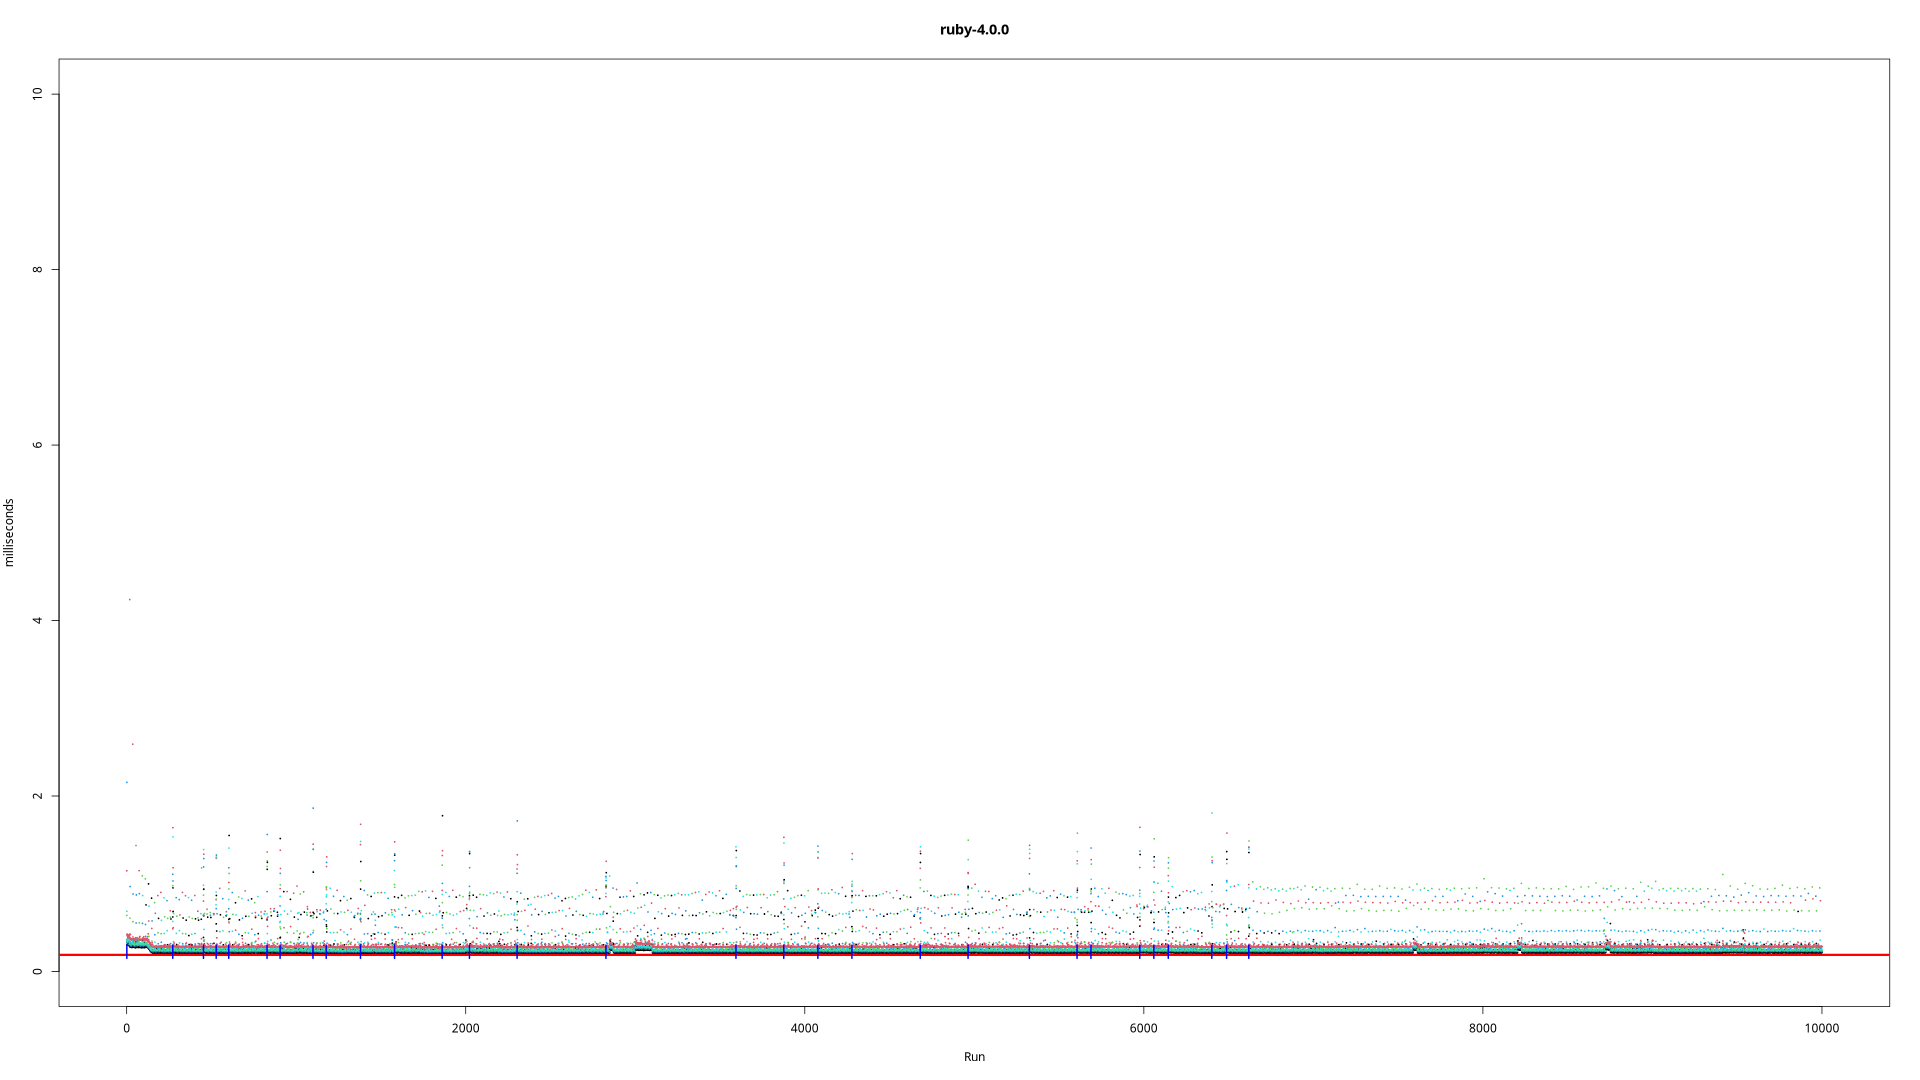
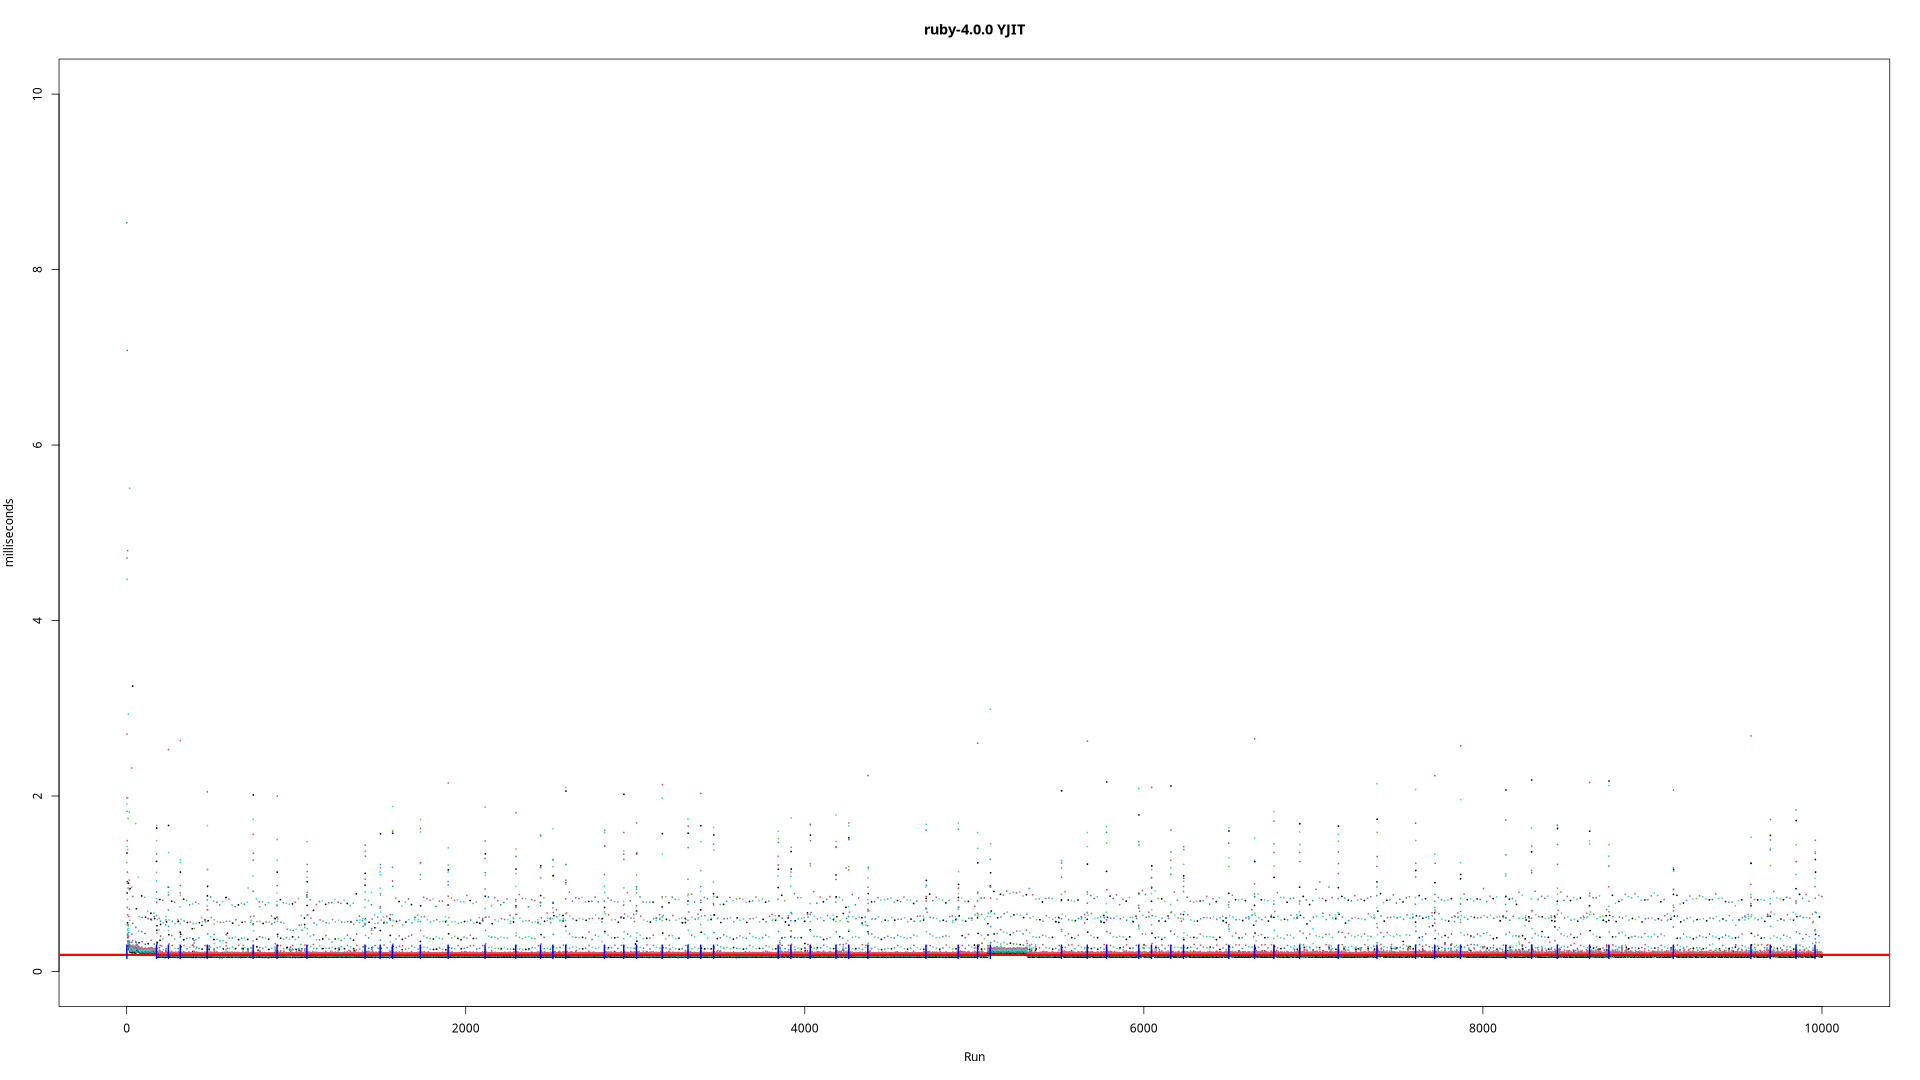
Ran the test again with 100k requests and the gem versions you mentioned. On my machine this takes 345 and 302 seconds for 4.0-preview2. Especially on the detail plot (like rodauth_2_ruby-4.0.0.png) the increasing response time is clearly visible. Same test on Ruby 3.4.7 shows neat horizontal lines.
You machine is clearly a lot faster than mine, maybe this hides performance degradation? Another difference between your plots and mine is the number of major garbage collection runs. These are indicated by the short blue vertical lines. Your plots show fairly regular GC runs. Mine only 1 very early in the test.
If higher memory usage is expected for 4.0 then no problems there. Memory usage seems to level off after ~10k requests anyway. Usually I run the tests 3 times, so more dots in the memory plot and better readable lines. I don't know why in your memory plot there are no measurements after ~15k. All values should be in file 'data/rodauth/memory.csv'.
Anyway, a bug is not a bug when it isn't reproducible. If you don't see any performance degradation then this bug report should be closed.
Updated by luke-gru (Luke Gruber) 3 months ago
- Status changed from Open to Closed
Updated by easydwh (Ivo Herweijer) 3 months ago
@luke-gru (Luke Gruber) FWIW 4.0.0-preview3 performs normally.